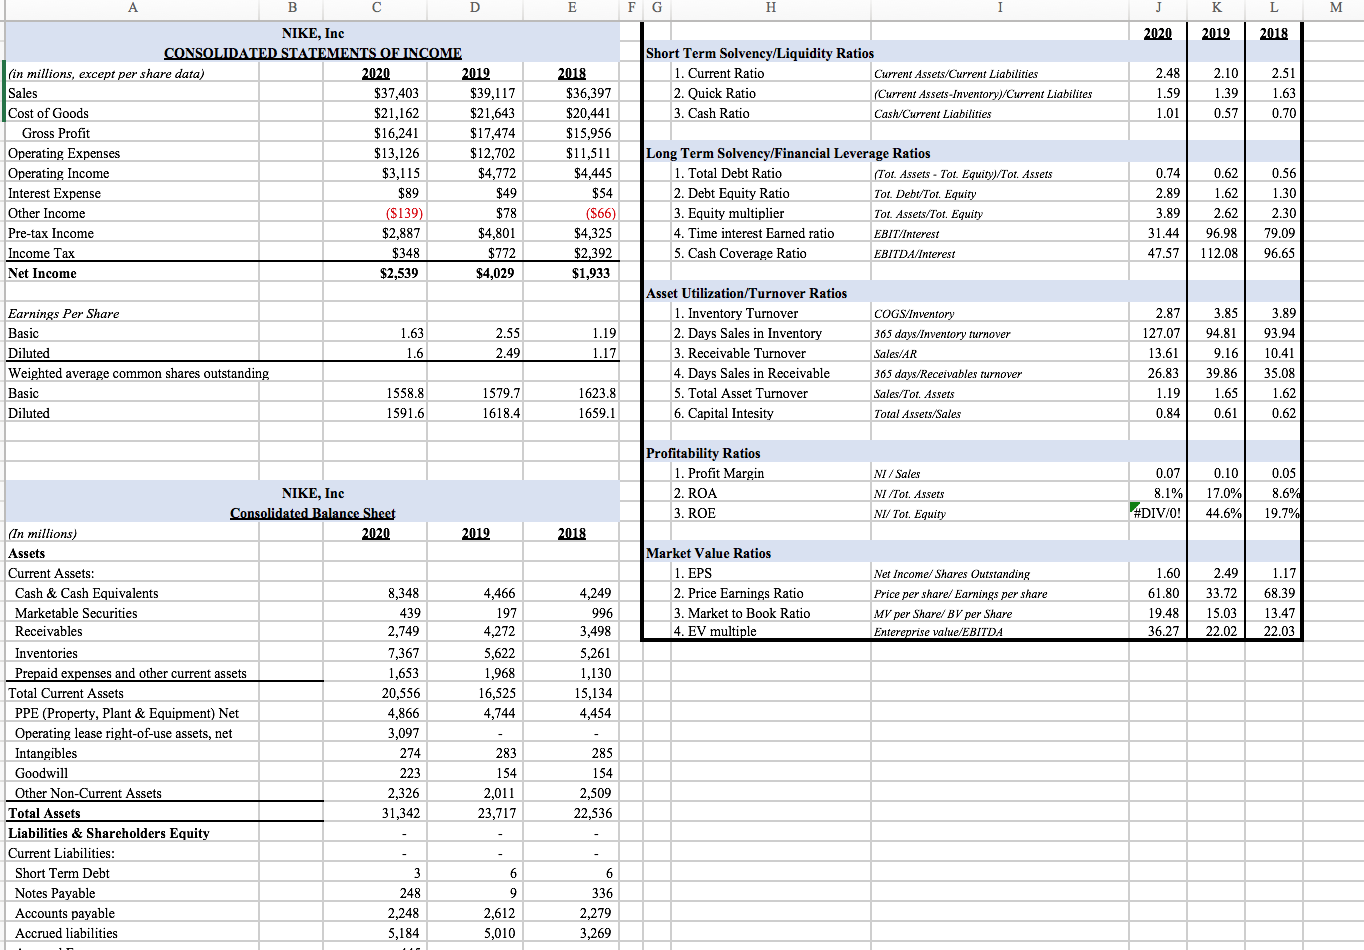
After computing the financial ratios (already done), Draw a conclusion of Nike's financial conditions over the last three years and provide recommendations for improvements.


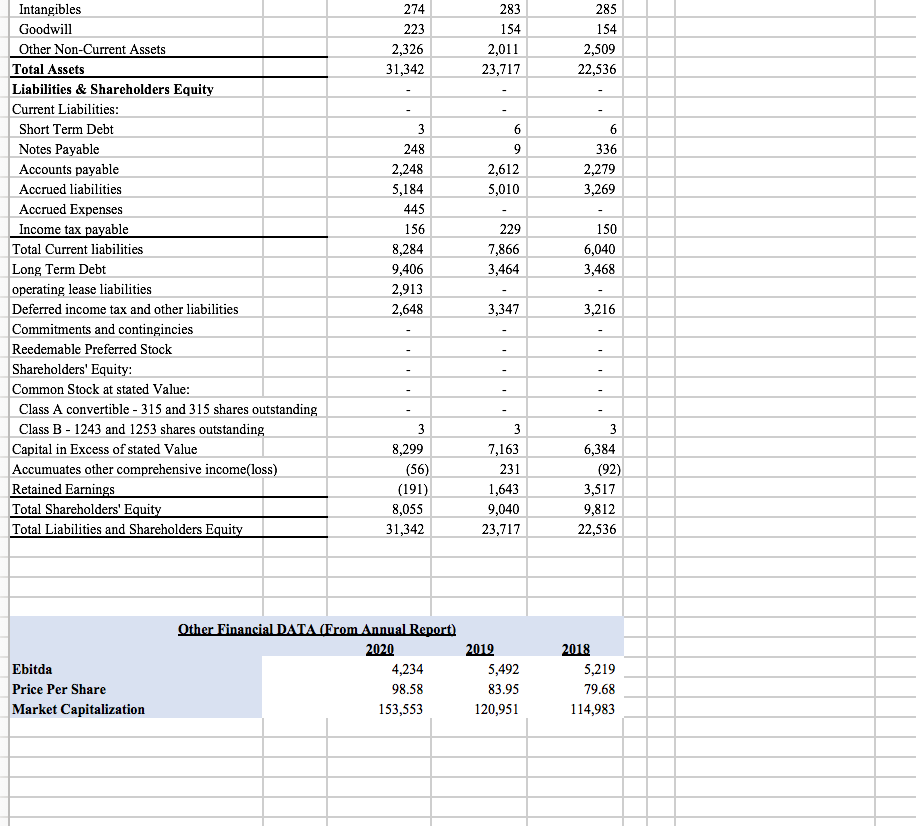
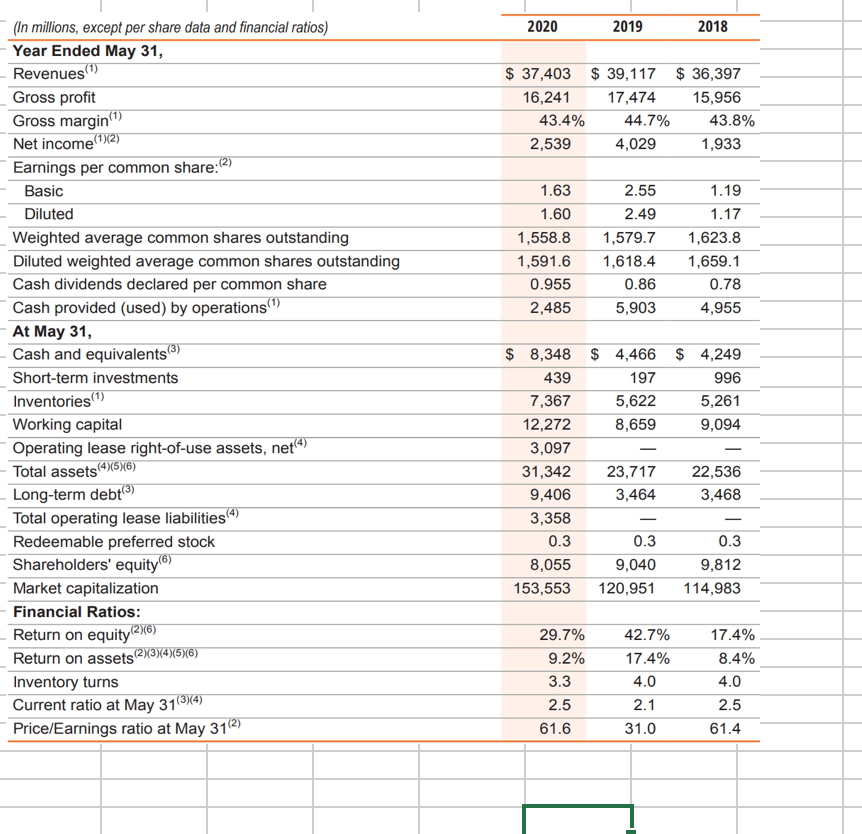
B D E F G H J K L M 2020 2019 2018 Short Term Solvency/Liquidity Ratios 1. Current Ratio Current Assets/Current Liabilities 2. Quick Ratio (Current Assets-Inventory)/Current Liabilites 3. Cash Ratio Cash/Current Liabilities 2.48 1.59 1.01 2.10 1.39 0.57 2.51 1.63 0.70 $21,162 NIKE, Inc CONSOLIDATED STATEMENTS OF INCOME (in millions, except per share data) 2020 2019 Sales $37,403 $39,117 Cost of Goods $21,643 Gross Profit $16,241 $17,474 Operating Expenses $13,126 $12,702 Operating Income $3,115 $4,772 Interest Expense $89 $49 Other Income ($139) $78 Pre-tax Income $2,887 $4,801 Income Tax $348 $772 Net Income $2,539 $4,029 2018 $36,397 $20,441 $15,956 $11,511 $4,445 $54 ($66) $4,325 $2,392 $1,933 Long Term Solvency/Financial Leverage Ratios 1. Total Debt Ratio (Tot. Assets - Tot. Equity)/Tot. Assets 2. Debt Equity Ratio Tot. Debt/Tot. Equity 3. Equity multiplier Tot. Assets/Tot. Equity 4. Time interest Earned ratio EBIT/Interest 5. Cash Coverage Ratio EBITDA Interest 0.74 2.89 3.89 0.62 1.62 2.62 96.98 112.08 0.56 1.30 2.30 79.09 96.65 31.44 47.57 2.87 127.07 1.63 1.6 2.55 2.49 1.19 1.17 Asset Utilization/Turnover Ratios 1. Inventory Turnover 2. Days Sales in Inventory 3. Receivable Turnover 4. Days Sales in Receivable 5. Total Asset Turnover 6. Capital Intesity Earnings Per Share Basic Diluted Weighted average common shares outstanding Basic Diluted 13.61 COGS/Inventory 365 days/Inventory turnover Sales/AR 365 days/Receivables turnover Sales/Tot Assets Total Assets/Sales 3.85 94.81 9.16 39.86 1.65 0.61 3.89 93.94 10.41 35.08 1.62 0.62 1558.8 1591.6 1579.7 1618.4 1623.8 1659.1 26.83 1.19 0.84 NI / Sales Profitability Ratios 1. Profit Margin 2. ROA 3. ROE NI/Tot Assets 0.07 8.1% #DIV/0! 0.10 17.0% 44.6% 0.05 8.6% 19.7% NI/ Tot. Equity 2019 2018 1.17 4,466 197 4,272 Market Value Ratios 1. EPS 2. Price Earnings Ratio 3. Market to Book Ratio 4. EV multiple Net Income/Shares Outstanding Price per share/ Earnings per share MV per Share/ BV per Share Entereprise value/EBITDA 1.60 61.80 19.48 36.27 2.49 33.72 15.03 22.02 68.39 13.47 22.03 5,622 NIKE, Inc Consolidated Balance Sheet (In millions) 2020 Assets Current Assets: Cash & Cash Equivalents 8,348 Marketable Securities 439 Receivables 2,749 Inventories 7,367 Prepaid expenses and other current assets 1,653 Total Current Assets 20,556 PPE (Property, Plant & Equipment) Net 4,866 Operating lease right-of-use assets, net Intangibles 274 Goodwill 223 Other Non-Current Assets 2,326 Total Assets 31,342 Liabilities & Shareholders Equity Current Liabilities: Short Term Debt 3 Notes Payable 248 Accounts payable 2,248 Accrued liabilities 5,184 4,249 996 3,498 5,261 1,130 15,134 4,454 1,968 16,525 4,744 3,097 283 154 2,011 23,717 285 154 2,509 22,536 - 6 9 6 336 2,279 3,269 2,612 5,010 274 223 2,326 31,342 283 154 2,011 23,717 285 154 2,509 22,536 6 9 2,612 5,010 6 336 2,279 3,269 Intangibles Goodwill Other Non-Current Assets Total Assets Liabilities & Shareholders Equity Current Liabilities: Short Term Debt Notes Payable Accounts payable Accrued liabilities Accrued Expenses Income tax payable Total Current liabilities Long Term Debt operating lease liabilities Deferred income tax and other liabilities Commitments and contingincies Reedemable Preferred Stock Shareholders' Equity: Common Stock at stated Value: Class A convertible - 315 and 315 shares outstanding Class B - 1243 and 1253 shares outstanding Capital in Excess of stated Value Accumuates other comprehensive income(loss) Retained Earnings Total Shareholders' Equity Total Liabilities and Shareholders Equity 3 248 2,248 5,184 445 156 8,284 9,406 2,913 2,648 229 7,866 3,464 150 6,040 3,468 3,347 3,216 3 8,299 (56) (191) 8,055 31,342 3 7,163 231 1,643 9,040 23,717 3 6,384 (92) 3,517 9,812 22,536 Ebitda Price Per Share Market Capitalization Other Financial DATA (From Annual Report) 2020 4,234 98.58 153,553 2019 5,492 83.95 120,951 2018 5,219 79.68 114,983 2020 2019 2018 $ 37,403 $ 39,117 $ 36,397 16,241 17,474 15,956 43.4% 44.7% 43.8% 2,539 4,029 1,933 1.63 1.60 1,558.8 1,591.6 0.955 2,485 2.55 2.49 1,579.7 1,618.4 0.86 5,903 1.19 1.17 1,623.8 1,659.1 0.78 4,955 (In millions, except per share data and financial ratios) Year Ended May 31, Revenues (1) Gross profit Gross margin) Net income (1)(2) Earnings per common share:(2) Basic Diluted Weighted average common shares outstanding Diluted weighted average common shares outstanding Cash dividends declared per common share Cash provided (used) by operations (1) At May 31, Cash and equivalents(3) Short-term investments Inventories (1) Working capital Operating lease right-of-use assets, net Total assets (485)6) Long-term debt Total operating lease liabilities (4) Redeemable preferred stock Shareholders' equity(6) Market capitalization Financial Ratios: Return on equity (2)(6) Return on assets(2)334)(5)(6) Inventory turns Current ratio at May 31(3)(4) Price/Earnings ratio at May 31(2) $ 8,348 $ 4,466 $ 4,249 439 197 996 7,367 5,622 5,261 12,272 8,659 9,094 3,097 31,342 23,717 22,536 9,406 3,464 3,468 3,358 0.3 0.3 0.3 8,055 9,040 9,812 153,553 120,951 114,983 29.7% 9.2% 3.3 2.5 61.6 42.7% 17.4% 4.0 2.1 31.0 17.4% 8.4% 4.0 2.5 61.4


