Answered step by step
Verified Expert Solution
Question
1 Approved Answer
Age range Sex Disorder No risk factors Diabetes Smoking High blood pressure High cholesterol 41~50 Female Present 20 15 60 58 83 41~50 Female Not
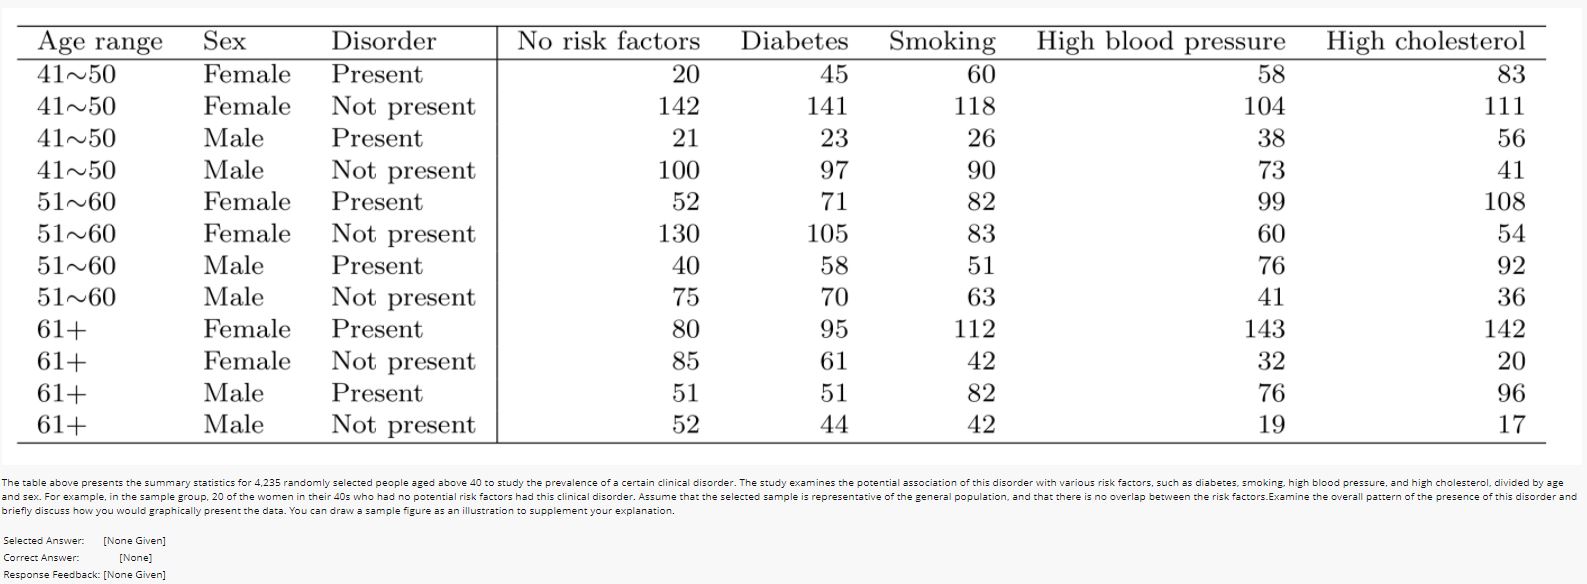
Age range Sex Disorder No risk factors Diabetes Smoking High blood pressure High cholesterol 41~50 Female Present 20 15 60 58 83 41~50 Female Not present 142 141 118 104 111 41~50 Male Present 21 23 26 38 56 41~50 Male Not present 100 97 90 73 41 51~60 Female Present 52 71 82 99 108 51~60 Female Not present 130 105 83 60 54 51~60 Male Present 40 58 51 76 92 51~60 Male Not present 75 70 63 41 36 61+ Female Present 80 95 112 143 142 61+ Female Not present 85 61 42 32 20 61+ Male Present 51 51 82 76 96 61+ Male Not present 52 44 42 19 17 The table above presents the summary statistics for 4,235 randomly selected people aged above 40 to study the prevalence of a certain clinical disorder. The study examines the potential association of this disorder with various risk factors, such as diabetes, smoking, high blood pressure, and high cholesterol, divided by age and sex. For example. in the sample group, 20 of the women in their 40s who had no potential risk factors had this clinical disorder. Assume that the selected sample is representative of the general population, and that there is no overlap between the risk factors.Examine the overall pattern of the presence of this disorder and briefly discuss how you would graphically present the data. You can draw a sample figure as an illustration to supplement your explanation. Selected Answer: [None Given] Correct Answer: [None Response Feedback: [None Given]
Step by Step Solution
There are 3 Steps involved in it
Step: 1
Get Instant Access to Expert-Tailored Solutions
See step-by-step solutions with expert insights and AI powered tools for academic success
Step: 2
Step: 3
Ace Your Homework with AI
Get the answers you need in no time with our AI-driven, step-by-step assistance
Get Started