

Answered step by step
Verified Expert Solution
Question
1 Approved Answer
Age Weight 15 21,66 15 22,75 15 22,3 18 31,25 28 44,79 29 40,55 37 50,25 37 46,88 44 52,03 50 63,47 50 61,13 60
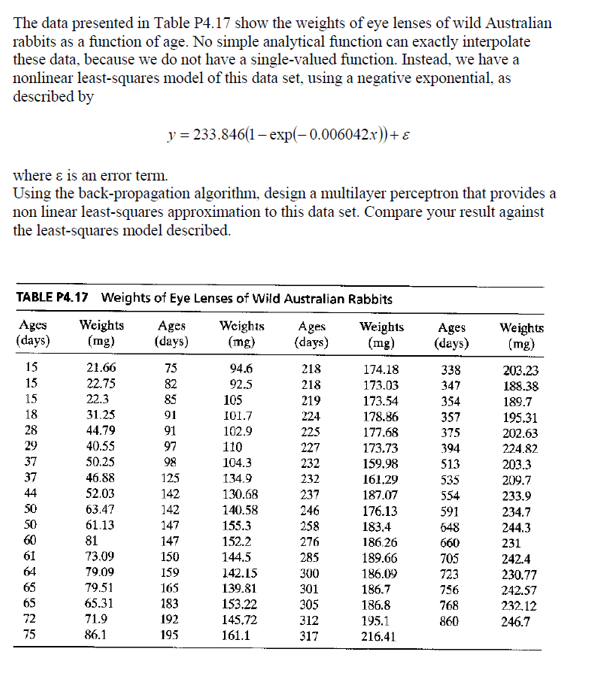
| Age | Weight |
| 15 | 21,66 |
| 15 | 22,75 |
| 15 | 22,3 |
| 18 | 31,25 |
| 28 | 44,79 |
| 29 | 40,55 |
| 37 | 50,25 |
| 37 | 46,88 |
| 44 | 52,03 |
| 50 | 63,47 |
| 50 | 61,13 |
| 60 | 81 |
| 61 | 73,09 |
| 64 | 79,09 |
| 65 | 79,51 |
| 65 | 65,31 |
| 72 | 71,9 |
| 75 | 86,1 |
| 75 | 94,6 |
| 82 | 92,5 |
| 85 | 105 |
| 91 | 101,7 |
| 91 | 102,9 |
| 97 | 110 |
| 98 | 104,3 |
| 125 | 134,9 |
| 142 | 130,68 |
| 142 | 140,58 |
| 147 | 155,3 |
| 147 | 152,2 |
| 150 | 144,5 |
| 159 | 142,15 |
| 165 | 139,81 |
| 183 | 153,22 |
| 192 | 145,72 |
| 195 | 161,1 |
| 218 | 174,18 |
| 218 | 173,03 |
| 219 | 173,54 |
| 224 | 178,86 |
| 225 | 177,68 |
| 227 | 173,73 |
| 232 | 159,98 |
| 232 | 161,29 |
| 237 | 187,07 |
| 246 | 176,13 |
| 258 | 183,4 |
| 276 | 186,26 |
| 285 | 189,66 |
| 300 | 186,09 |
| 301 | 186,7 |
| 305 | 186,8 |
| 312 | 195,1 |
| 317 | 216,41 |
| 338 | 203,23 |
| 347 | 183,38 |
| 354 | 189,7 |
| 357 | 195,31 |
| 375 | 202,63 |
| 394 | 224,82 |
| 513 | 203,3 |
| 535 | 209,7 |
| 554 | 233,9 |
| 591 | 234,7 |
| 648 | 244,3 |
| 660 | 231 |
| 705 | 242,4 |
| 723 | 230,77 |
| 756 | 242,57 |
| 768 | 232,12 |
| 860 | 246,7 |
Step by Step Solution
There are 3 Steps involved in it
Step: 1

Get Instant Access to Expert-Tailored Solutions
See step-by-step solutions with expert insights and AI powered tools for academic success
Step: 2

Step: 3
Ace Your Homework with AI
Get the answers you need in no time with our AI-driven, step-by-step assistance
Get Started
Professional Microsoft SQL Server 2014 Administration
Authors: Adam Jorgensen, Bradley Ball
1st Edition
111885926X, 9781118859261