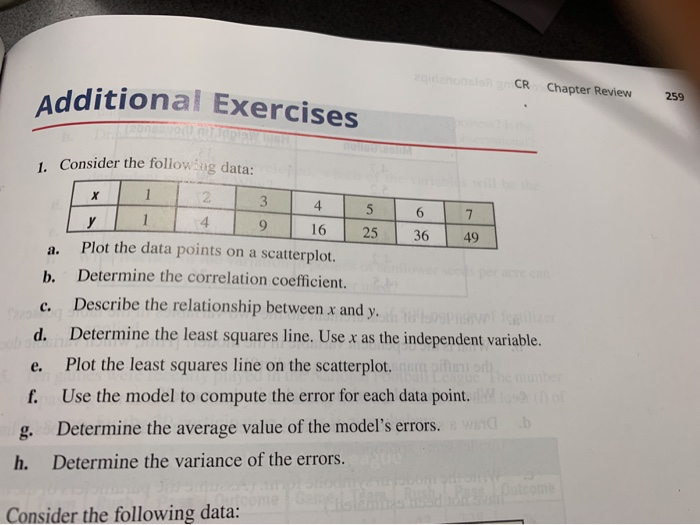
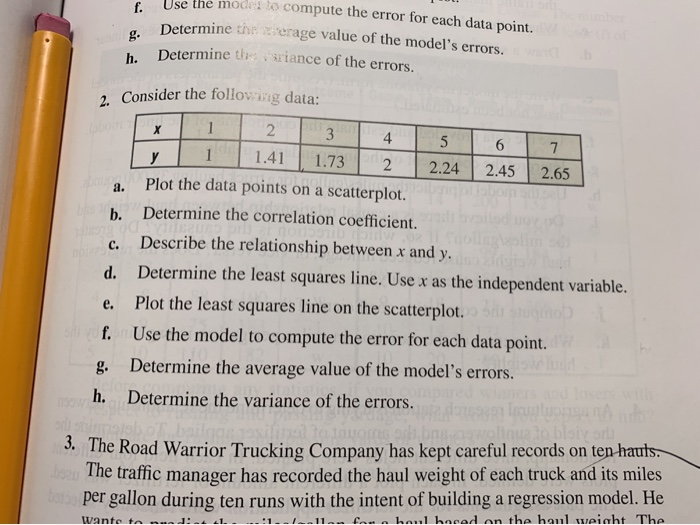
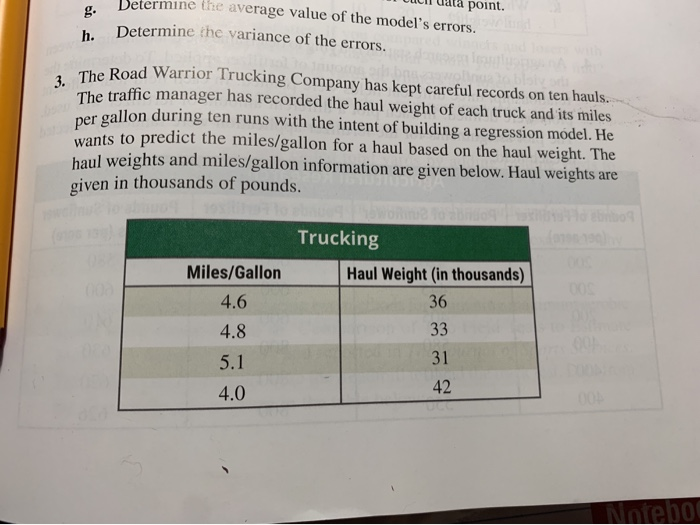
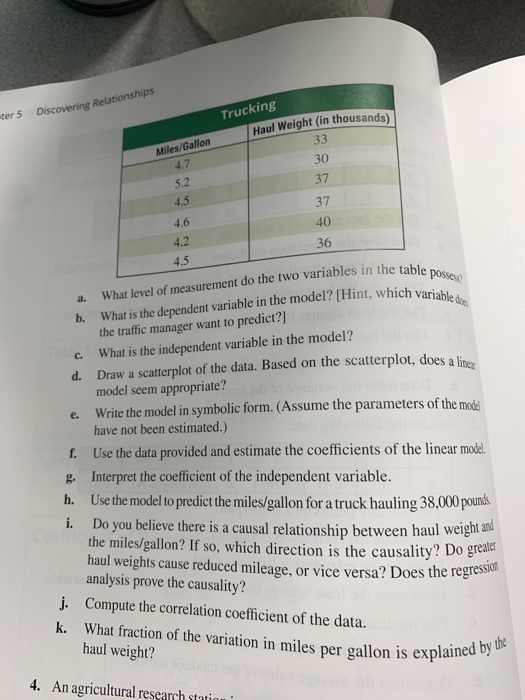
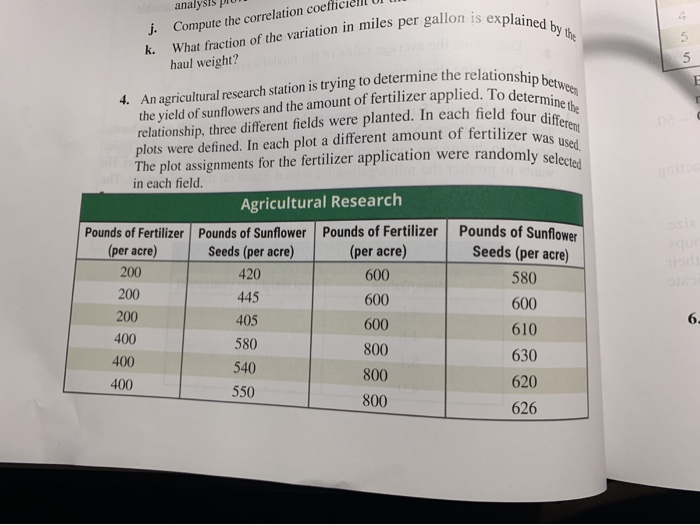
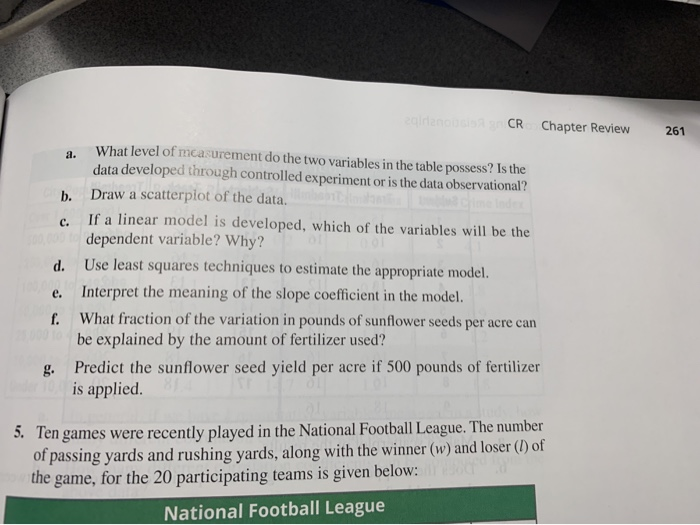
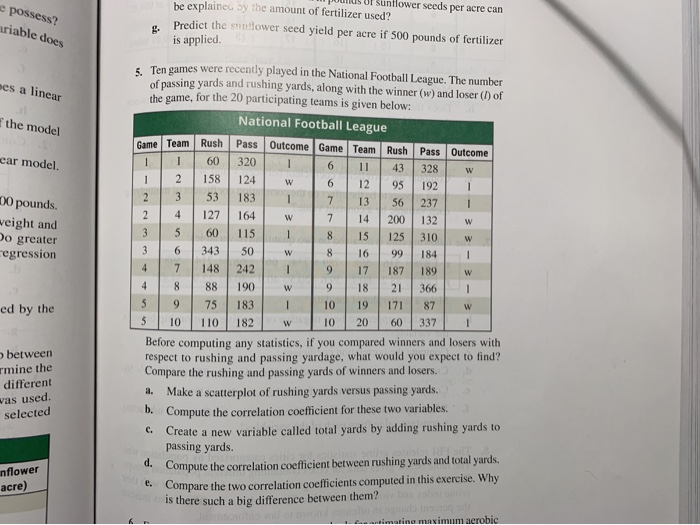
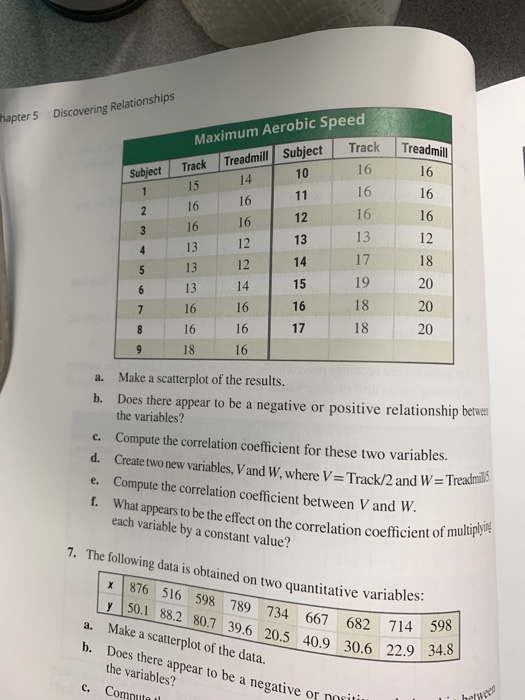
agilenobelon an CR Chapter Review 259 Additional Exercises 1. Consider the following data: X 2 3 4 5 6 7 4 9 16 25 36 49 a. Plot the data points on a scatterplot. b. Determine the correlation coefficient. c. Describe the relationship between x and youngvol fentilizer d. Determine the least squares line. Use x as the independent variable. e. Plot the least squares line on the scatterplot. nung pient or The munber f. Use the model to compute the error for each data point. Mor g. Determine the average value of the model's errors. s wind b h. Determine the variance of the errors. come ome Consider the following data:f. Use the moon. to compute the error for each data point. g. Determine the average value of the model's errors. wind .b h. Determine the variance of the errors. 2. Consider the following data: Isbom X 2 3 4 5 6 7 1.41 1.73 2 2.24 2.45 2.65 a. Plot the data points on a scatterplot. b. Determine the correlation coefficient. 51857 Mollagleslim sdi c. Describe the relationship between x and y. d. Determine the least squares line. Use x as the independent variable. e. Plot the least squares line on the scatterplot. Sir sluginto o of. Use the model to compute the error for each data point. g. Determine the average value of the model's errors. iswolused ers and losers with 19ew h. Determine the variance of the errors. 3. The Road Warrior Trucking Company has kept careful records on ten hauls. The traffic manager has recorded the haul weight of each truck and its miles bor per gallon during ten runs with the intent of building a regression model. He wil hazard on the haul weight The Wants tolata point. g. Determine the average value of the model's errors. h. Determine the variance of the errors. 1. The Road Warrior Trucking Company has kept careful records on ten hauls. The traffic manager has recorded the haul weight of each truck and its miles per gallon during ten runs with the intent of building a regression model. He wants to predict the miles/gallon for a haul based on the haul weight. The haul weights and miles/gallon information are given below. Haul weights are given in thousands of pounds. Pid elinbog Trucking Miles/Gallon Haul Weight (in thousands) 008 4.6 36 4.8 33 5.1 31 4.0 42 Noteboter 5 Discovering Relationships Trucking Haul Weight (in thousands) Miles/Gallon 33 4.7 30 5.2 37 4.5 37 4.6 40 4.2 36 4.5 a. What level of measurement do the two variables in the table possess b. What is the dependent variable in the model? [Hint, which variable day the traffic manager want to predict?] C. What is the independent variable in the model? d. Draw a scatterplot of the data. Based on the scatterplot, does a lines model seem appropriate? e. Write the model in symbolic form. (Assume the parameters of the model have not been estimated.) f. Use the data provided and estimate the coefficients of the linear model. g. Interpret the coefficient of the independent variable. h. Use the model to predict the miles/gallon for a truck hauling 38,000 pounds i. Do you believe there is a causal relationship between haul weight and the miles/gallon? If so, which direction is the causality? Do greater haul weights cause reduced mileage, or vice versa? Does the regression analysis prove the causality? j. Compute the correlation coefficient of the data. haul weight? k. What fraction of the variation in miles per gallon is explained by the 4. An agricultural researchanalysis j. Compute the correlation coefficient K. What fraction of the variation in miles per gallon is explained by haul weight? 4. An agricultural research station is trying to determine the relationship between the yield of sunflowers and the amount of fertilizer applied. To determine the relationship, three different fields were planted. In each field four different plots were defined. In each plot a different amount of fertilizer was used The plot assignments for the fertilizer application were randomly selected in each field. Agricultural Research Pounds of Fertilizer Pounds of Sunflower Pounds of Fertilizer Pounds of Sunflower osia (per acre) Seeds (per acre) (per acre) Seeds (per acre) equo usidi 200 420 600 580 200 445 600 600 200 405 600 6. 400 610 580 800 400 630 540 800 400 550 620 800 626egirlanonsisA g CR Chapter Review 261 a. What level of measurement do the two variables in the table possess? Is the data developed through controlled experiment or is the data observational? b. Draw a scatterplot of the data. c. If a linear model is developed, which of the variables will be the dependent variable? Why? d. Use least squares techniques to estimate the appropriate model. e. Interpret the meaning of the slope coefficient in the model. f. What fraction of the variation in pounds of sunflower seeds per acre can be explained by the amount of fertilizer used? g. Predict the sunflower seed yield per acre if 500 pounds of fertilizer is applied. 5. Ten games were recently played in the National Football League. The number of passing yards and rushing yards, along with the winner (w) and loser (1) of the game, for the 20 participating teams is given below: National Football LeagueI sunflower seeds per acre can be explained by the amount of fertilizer used? possess? g. Predict the sunflower seed yield per acre if 500 pounds of fertilizer riable does is applied. 5. Ten games were recently played in the National Football League. The number of passing yards and rushing yards, along with the winner (w) and loser (1) of es a linear the game, for the 20 participating teams is given below: National Football League the model Game Team Rush Pass Outcome Game Team Rush Pass Outcome 320 car model. 11 43 328 2 158 124 12 95 192 53 183 13 56 237 00 pounds. 2 4 127 164 7 14 200 132 W weight and 3 60 115 15 125 310 Do greater 3 6 343 50 W 16 184 egression 17 148 242 17 187 189 88 190 18 21 366 75 183 10 19 171 87 ed by the 10 110 182 10 20 60 337 Before computing any statistics, if you compared winners and losers with between respect to rushing and passing yardage, what would you expect to find? rmine the Compare the rushing and passing yards of winners and losers. different a. Make a scatterplot of rushing yards versus passing yards. vas used. b. Compute the correlation coefficient for these two variables. selected Create a new variable called total yards by adding rushing yards to passing yards. d. Compute the correlation coefficient between rushing yards and total yards. nflower e. Compare the two correlation coefficients computed in this exercise. Why acre) is there such a big difference between them?oly ban ating maximum aerobichapter 5 Discovering Relationships Maximum Aerobic Speed Treadmill Subject Track Treadmill Subject Track 10 16 14 16 15 16 16 16 11 16 12 16 16 16 16 12 13 12 13 13 12 14 17 13 18 5 13 14 15 19 20 16 16 16 18 20 16 16 17 18 20 18 16 a. Make a scatterplot of the results. b. Does there appear to be a negative or positive relationship betwe the variables? c. Compute the correlation coefficient for these two variables. d. Create two new variables, Vand W, where V = Track/2 and W = Treadmills e. Compute the correlation coefficient between V and W. f. What appears to be the effect on the correlation coefficient of multiply! each variable by a constant value? X 7. The following data is obtained on two quantitative variables: 50.1 876 516 598 789 734 667 682 714 598 A. 88.2 80.7 39.6 20.5 40.9 30.6 22.9 34.8 Make a scatterplot of the data. b. Does there appear to be a negative or n the variables? C. Compu
