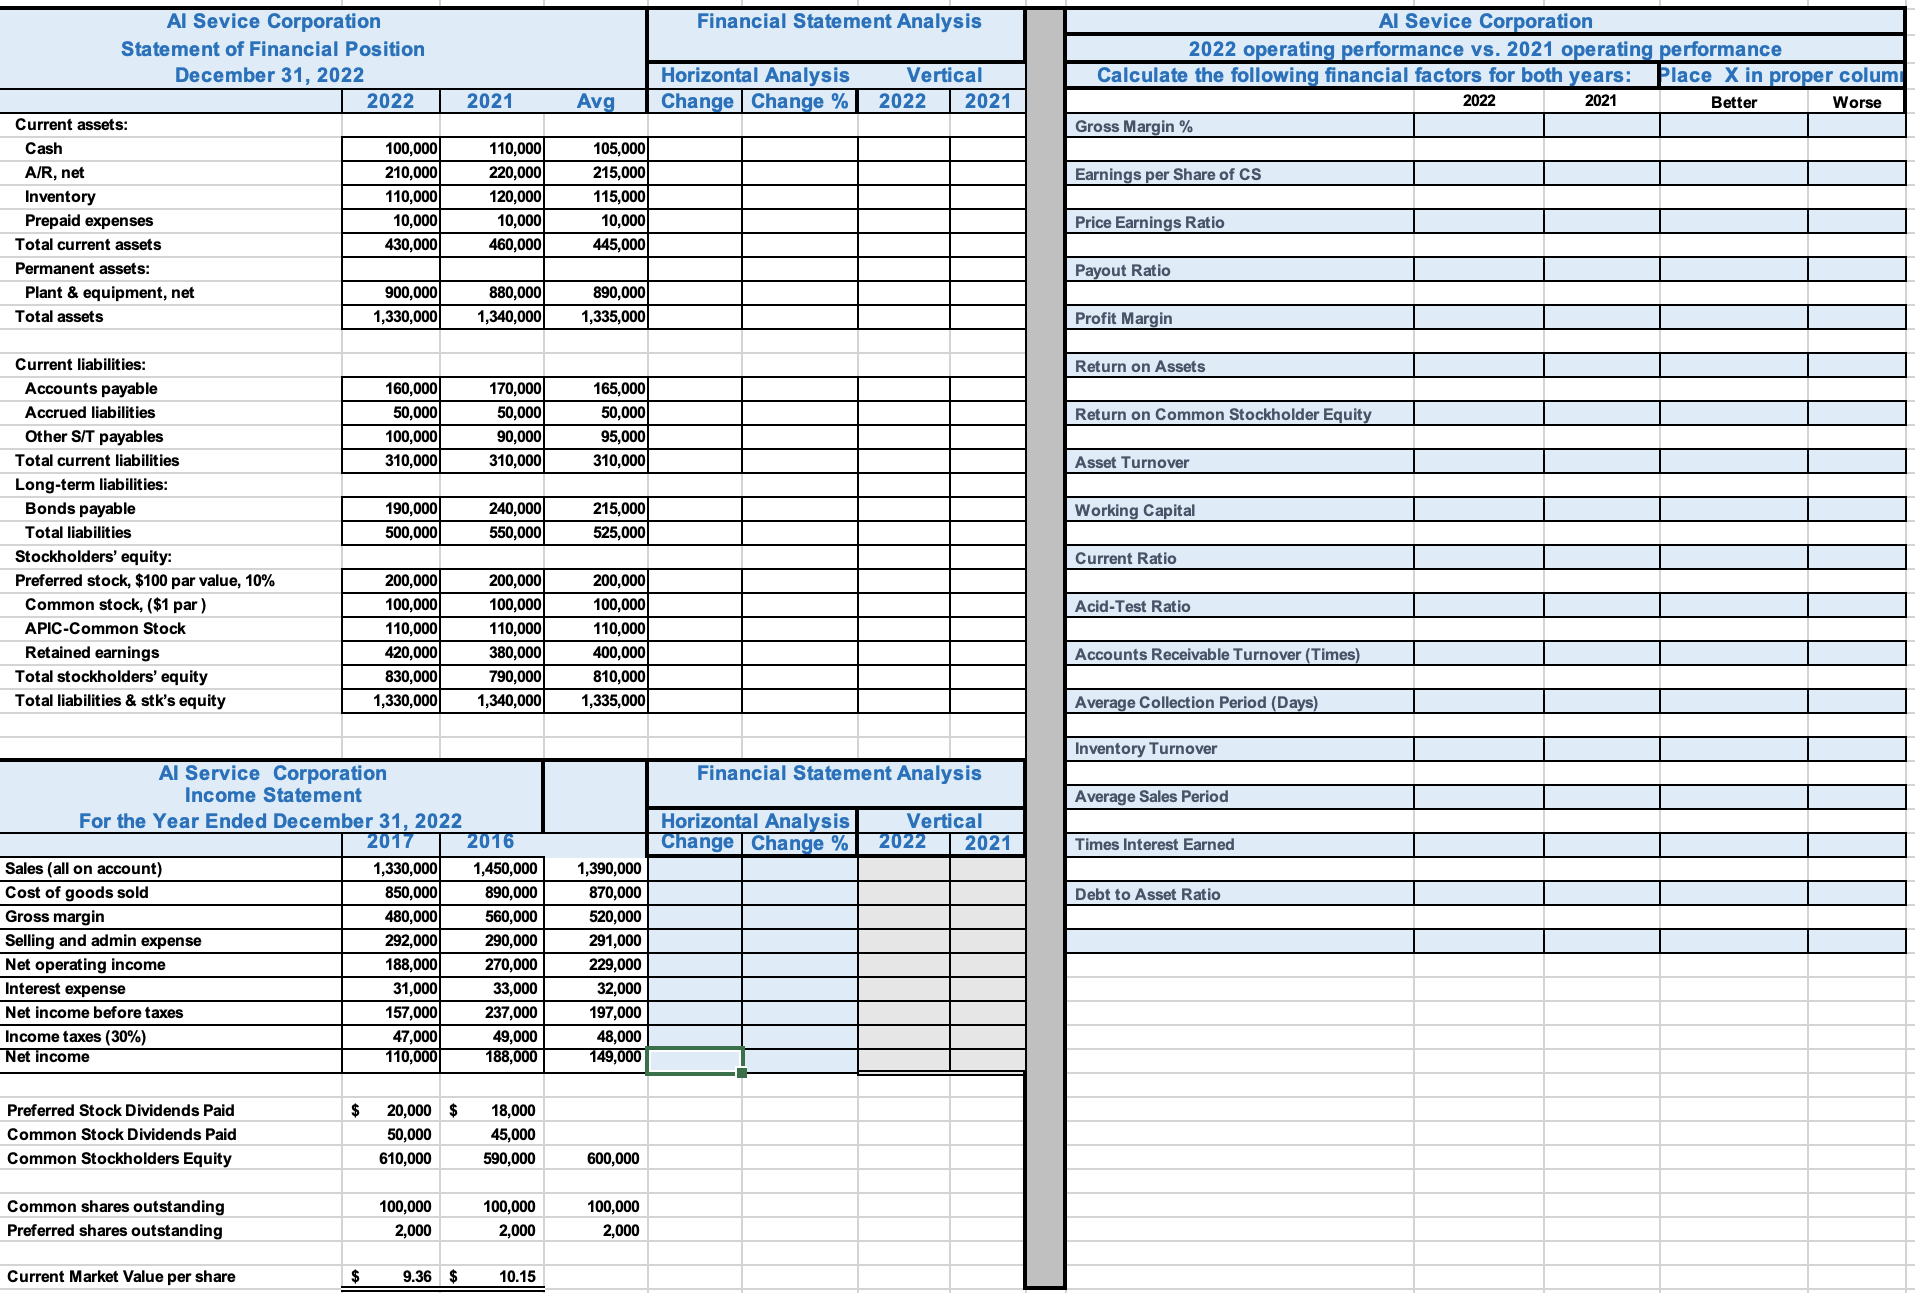
Al Sevice Corporation 2022 operating performance vs. 2021 operating performance Calculate the following financial factors for both years: Place X in proper colum 2022

Al Sevice Corporation 2022 operating performance vs. 2021 operating performance Calculate the following financial factors for both years: Place X in proper colum 2022 2021 Better Worse Al Sevice Corporation Statement of Financial Position December 31, 2022 Financial Statement Analysis Horizontal Analysis Vertical 2022 2021 Avg Change Change % 2022 2021 Current assets: Cash Gross Margin % 100,000 110,000 105,000 A/R, net Inventory 210,000 220,000 215,000 Earnings per Share of CS 110,000 120,000 115,000 Prepaid expenses 10,000 10,000 10,000 Price Earnings Ratio Total current assets 430,000 460,000 445,000 Permanent assets: Payout Ratio Plant & equipment, net 900,000 880,000 Total assets 1,330,000 1,340,000 890,000 1,335,000 Profit Margin Current liabilities: Return on Assets Accounts payable 160,000 170,000 165,000 Accrued liabilities 50,000 50,000 50,000 Other S/T payables 100,000 90,000 95,000 Total current liabilities 310,000 310,000 310,000 Long-term liabilities: Bonds payable 190,000 240,000 215,000 Total liabilities 500,000 550,000 525,000 Stockholders' equity: Preferred stock, $100 par value, 10% 200,000 200,000 200,000 Common stock, ($1 par) 100,000 100,000 100,000 APIC-Common Stock 110,000 110,000 110,000 Retained earnings 420,000 380,000 400,000 Total stockholders' equity 830,000 790,000 810,000 Total liabilities & stk's equity 1,330,000 1,340,000 1,335,000 Al Service Corporation Income Statement For the Year Ended December 31, 2022 2017 Sales (all on account) 1,330,000 Cost of goods sold 850,000 2016 1,450,000 890,000 1,390,000 870,000 Gross margin 480,000 560,000 520,000 Selling and admin expense 292,000 290,000 291,000 Net operating income 188,000 270,000 229,000 Interest expense 31,000 33,000 32,000 Net income before taxes Income taxes (30%) Net income 157,000 47,000 110,000 237,000 197,000 49,000 188,000 48,000 149,000 Preferred Stock Dividends Paid Common Stock Dividends Paid Common Stockholders Equity Common shares outstanding Preferred shares outstanding $ 20,000 $ 18,000 50,000 610,000 45,000 590,000 600,000 100,000 100,000 100,000 2,000 2,000 2,000 Current Market Value per share $ 9.36 $ 10.15 Return on Common Stockholder Equity Asset Turnover Working Capital Current Ratio Acid-Test Ratio Accounts Receivable Turnover (Times) Average Collection Period (Days) Inventory Turnover Average Sales Period Vertical 2021 Times Interest Earned Financial Statement Analysis Horizontal Analysis | Change | Change % 2022 Debt to Asset Ratio
Step by Step Solution
There are 3 Steps involved in it
Step: 1
Detailed Explanation Horizontal Analysis Balance Sheet 1 Current Assets Cash100000 2022 vs 110000 2021 AR net210000 2022 vs 220000 2021 Inventory10000 2022 vs 10000 2021 Prepaid Expenses10000 2022 vs ...
See step-by-step solutions with expert insights and AI powered tools for academic success
Step: 2

Step: 3

Ace Your Homework with AI
Get the answers you need in no time with our AI-driven, step-by-step assistance
Get Started


