

Answered step by step
Verified Expert Solution
Question
1 Approved Answer
algorithm solve correct plz Part I. In the theoretical part, you are requested to: a. Redesign the Radix sort using any other suitable comparison sort.
algorithm solve correct plz
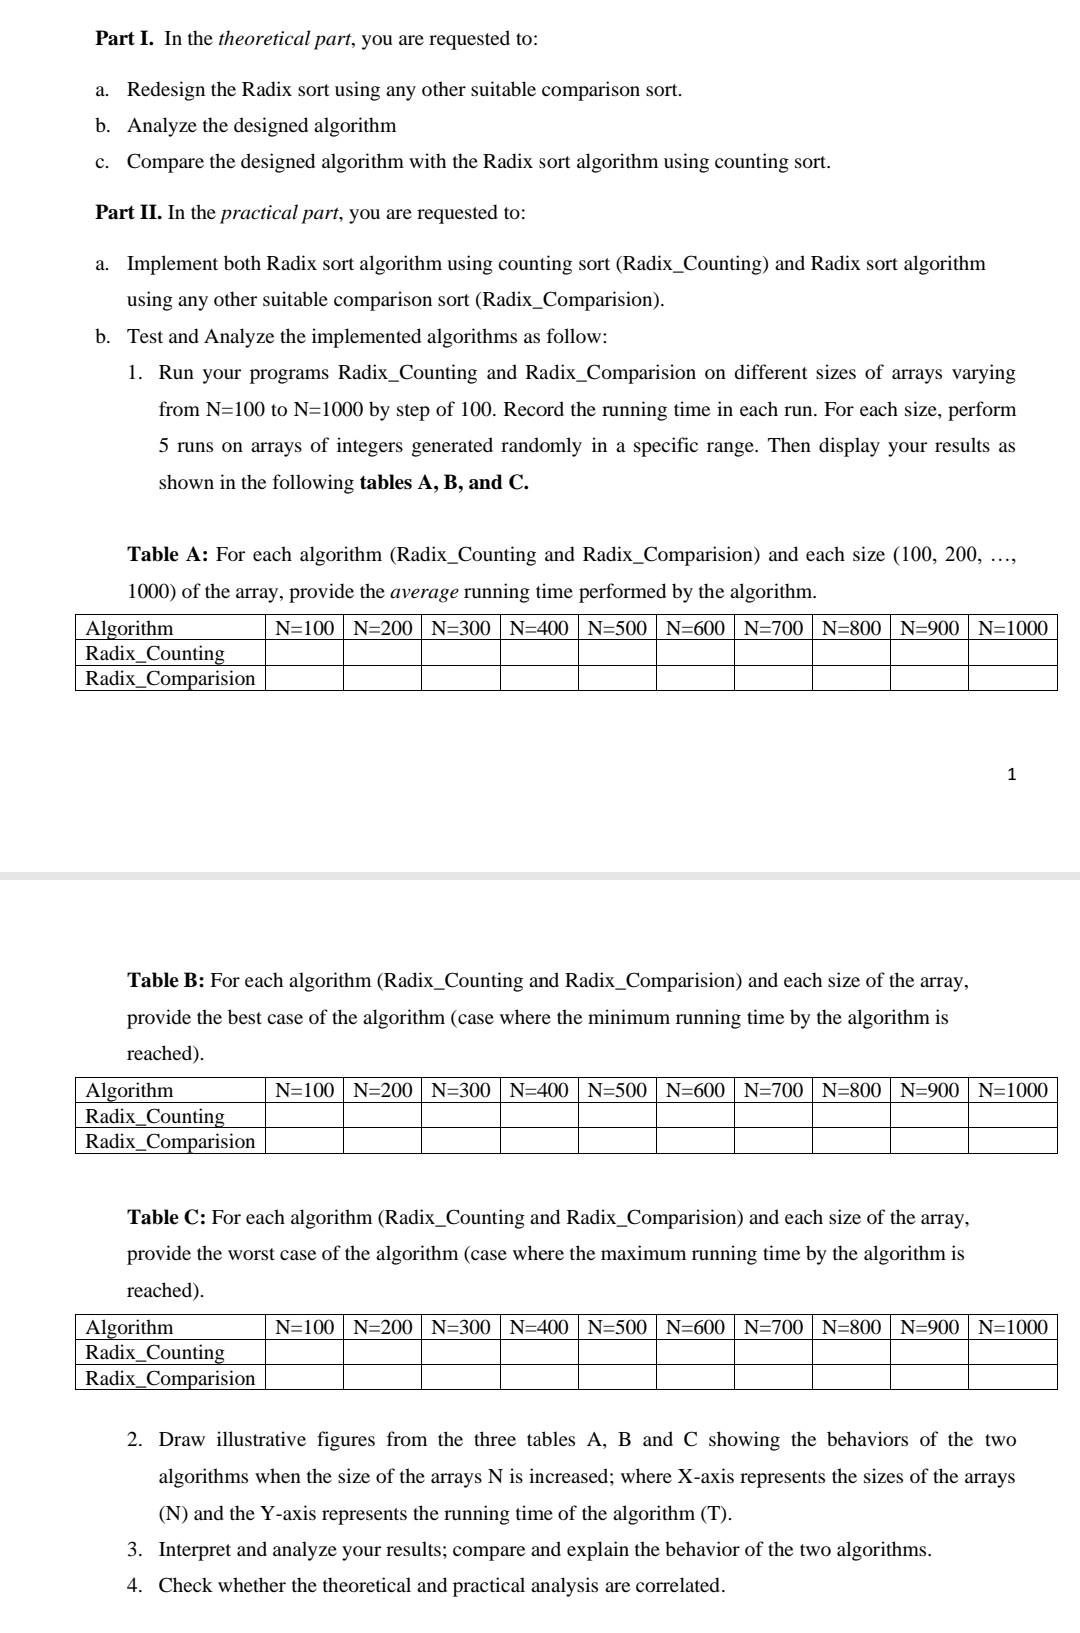
Part I. In the theoretical part, you are requested to: a. Redesign the Radix sort using any other suitable comparison sort. b. Analyze the designed algorithm c. Compare the designed algorithm with the Radix sort algorithm using counting sort. Part II. In the practical part, you are requested to: a. Implement both Radix sort algorithm using counting sort (Radix_Counting) and Radix sort algorithm using any other suitable comparison sort (Radix_Comparision). b. Test and Analyze the implemented algorithms as follow: 1. Run your programs Radix_Counting and Radix_Comparision on different sizes of arrays varying from N=100 to N=1000 by step of 100. Record the running time in each run. For each size, perform 5 runs on arrays of integers generated randomly in a specific range. Then display your results as shown in the following tables A, B, and C. Table A: For each algorithm (Radix_Counting and Radix_Comparision) and each size (100, 200, ..., 1000) of the array, provide the average running time performed by the algorithm. Algorithm N=100 N=200 N=300 N=400 N=500 N=600 N=700 N=800 N=900 N=1000 Radix_Counting Radix_Comparision 1 Table B: For each algorithm (Radix_Counting and Radix_Comparision) and each size of the array, provide the best case of the algorithm (case where the minimum running time by the algorithm is reached). Algorithm N=100 N=200 N=300 N=400 N=500 N=600 N=700 N=800 N=900 N=1000 Radix_Counting Radix_Comparision Table C: For each algorithm (Radix_Counting and Radix_Comparision) and each size of the array, provide the worst case of the algorithm (case where the maximum running time by the algorithm is reached). Algorithm N=100N=200 N=300 N=400 N=500 N=600 N=700 N=800 N=900 N=1000 Radix_Counting Radix_Comparision 2. Draw illustrative figures from the three tables A, B and C showing the behaviors of the two algorithms when the size of the arrays N is increased; where X-axis represents the sizes of the arrays (N) and the Y-axis represents the running time of the algorithm (T). 3. Interpret and analyze your results; compare and explain the behavior of the two algorithms. 4. Check whether the theoretical and practical analysis are correlated. Part I. In the theoretical part, you are requested to: a. Redesign the Radix sort using any other suitable comparison sort. b. Analyze the designed algorithm c. Compare the designed algorithm with the Radix sort algorithm using counting sort. Part II. In the practical part, you are requested to: a. Implement both Radix sort algorithm using counting sort (Radix_Counting) and Radix sort algorithm using any other suitable comparison sort (Radix_Comparision). b. Test and Analyze the implemented algorithms as follow: 1. Run your programs Radix_Counting and Radix_Comparision on different sizes of arrays varying from N=100 to N=1000 by step of 100. Record the running time in each run. For each size, perform 5 runs on arrays of integers generated randomly in a specific range. Then display your results as shown in the following tables A, B, and C. Table A: For each algorithm (Radix_Counting and Radix_Comparision) and each size (100, 200, ..., 1000) of the array, provide the average running time performed by the algorithm. Algorithm N=100 N=200 N=300 N=400 N=500 N=600 N=700 N=800 N=900 N=1000 Radix_Counting Radix_Comparision 1 Table B: For each algorithm (Radix_Counting and Radix_Comparision) and each size of the array, provide the best case of the algorithm (case where the minimum running time by the algorithm is reached). Algorithm N=100 N=200 N=300 N=400 N=500 N=600 N=700 N=800 N=900 N=1000 Radix_Counting Radix_Comparision Table C: For each algorithm (Radix_Counting and Radix_Comparision) and each size of the array, provide the worst case of the algorithm (case where the maximum running time by the algorithm is reached). Algorithm N=100N=200 N=300 N=400 N=500 N=600 N=700 N=800 N=900 N=1000 Radix_Counting Radix_Comparision 2. Draw illustrative figures from the three tables A, B and C showing the behaviors of the two algorithms when the size of the arrays N is increased; where X-axis represents the sizes of the arrays (N) and the Y-axis represents the running time of the algorithm (T). 3. Interpret and analyze your results; compare and explain the behavior of the two algorithms. 4. Check whether the theoretical and practical analysis are correlatedStep by Step Solution
There are 3 Steps involved in it
Step: 1

Get Instant Access to Expert-Tailored Solutions
See step-by-step solutions with expert insights and AI powered tools for academic success
Step: 2

Step: 3
Ace Your Homework with AI
Get the answers you need in no time with our AI-driven, step-by-step assistance
Get Started
Hands On Database
Authors: Steve Conger
1st Edition
013610827X, 978-0136108276