

Answered step by step
Verified Expert Solution
Question
1 Approved Answer
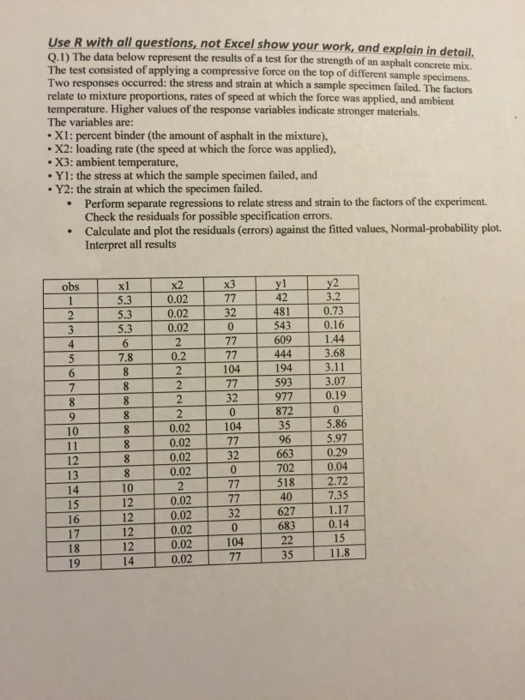
The data below represent the results of a test for the strength of an asphalt concrete mix. The test consisted of applying a compressive force
Step by Step Solution
There are 3 Steps involved in it
Step: 1

Get Instant Access to Expert-Tailored Solutions
See step-by-step solutions with expert insights and AI powered tools for academic success
Step: 2

Step: 3
Ace Your Homework with AI
Get the answers you need in no time with our AI-driven, step-by-step assistance
Get Started
Hands On Database
Authors: Steve Conger
1st Edition
013610827X, 978-0136108276