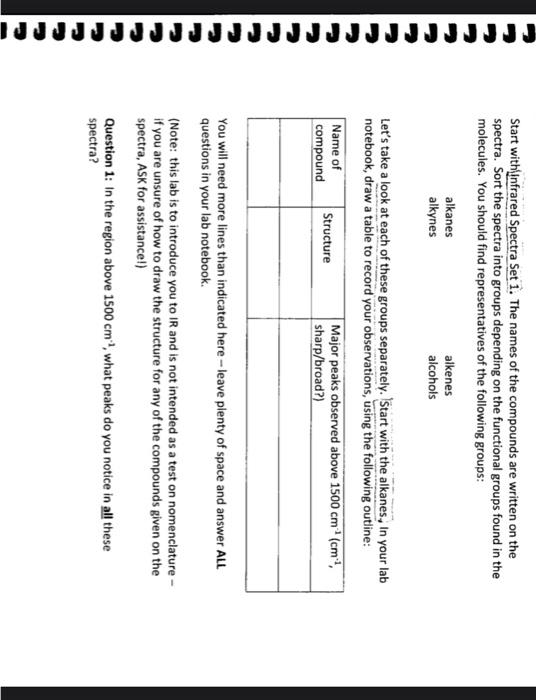
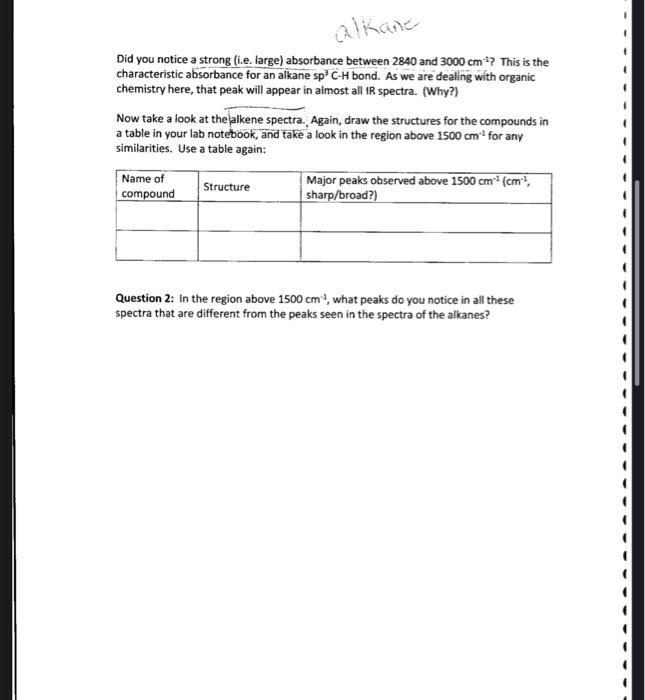
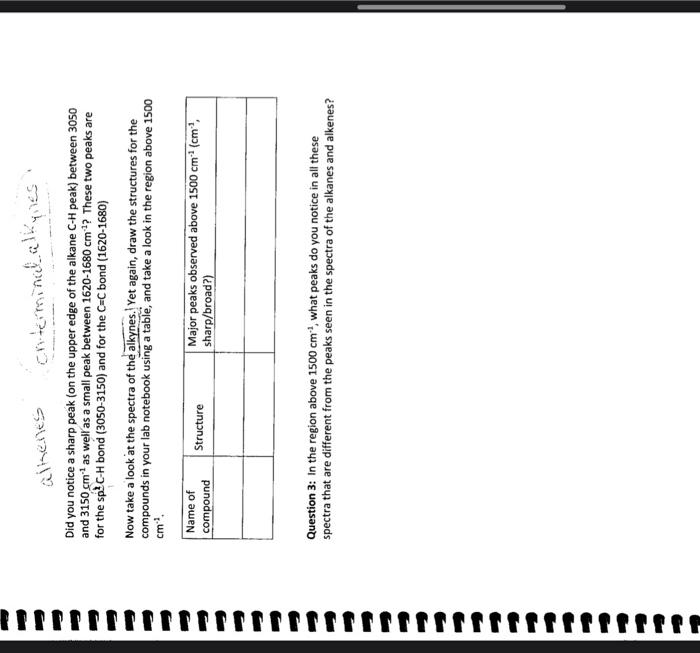
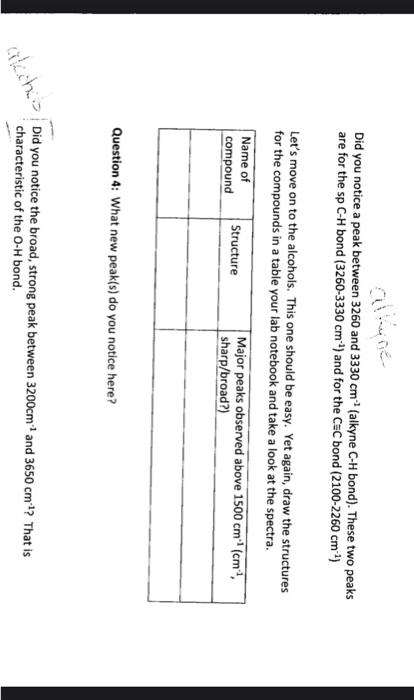
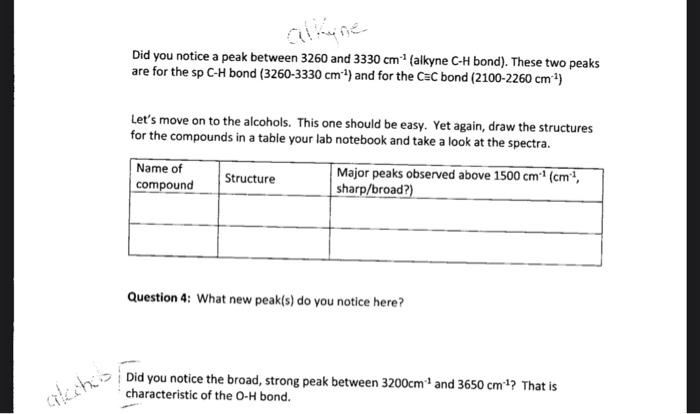
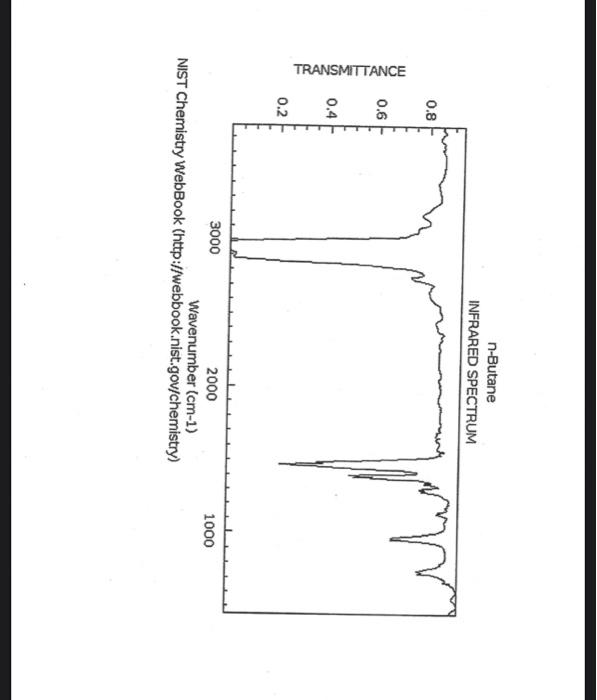
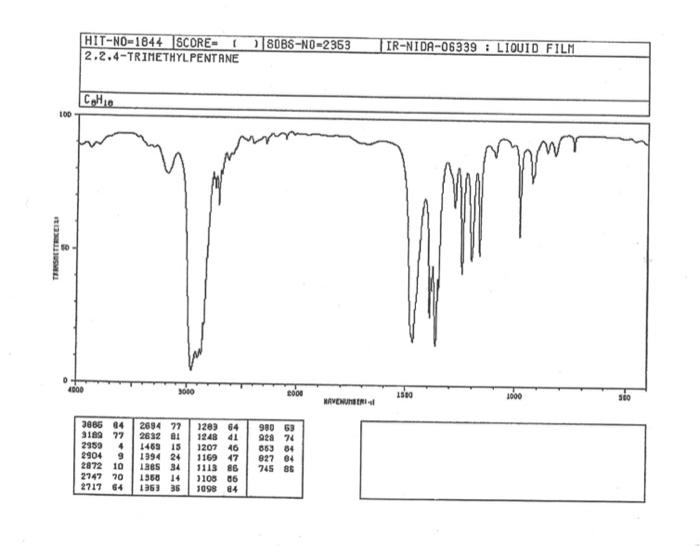
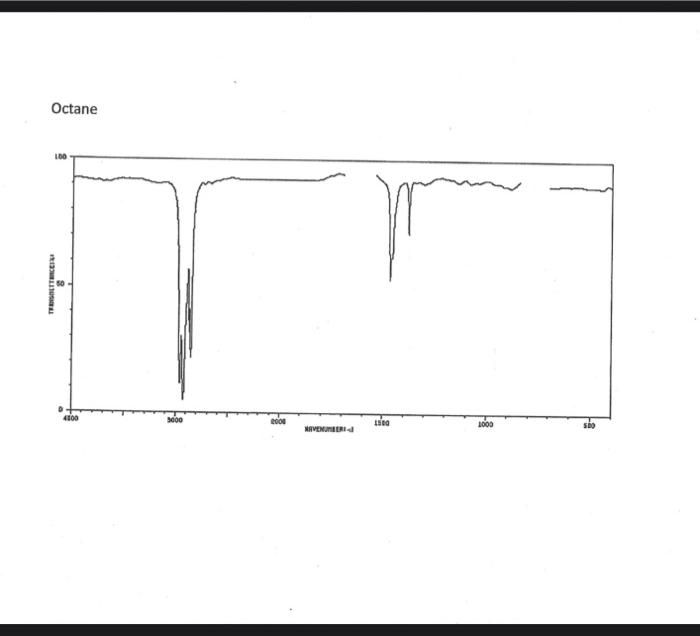
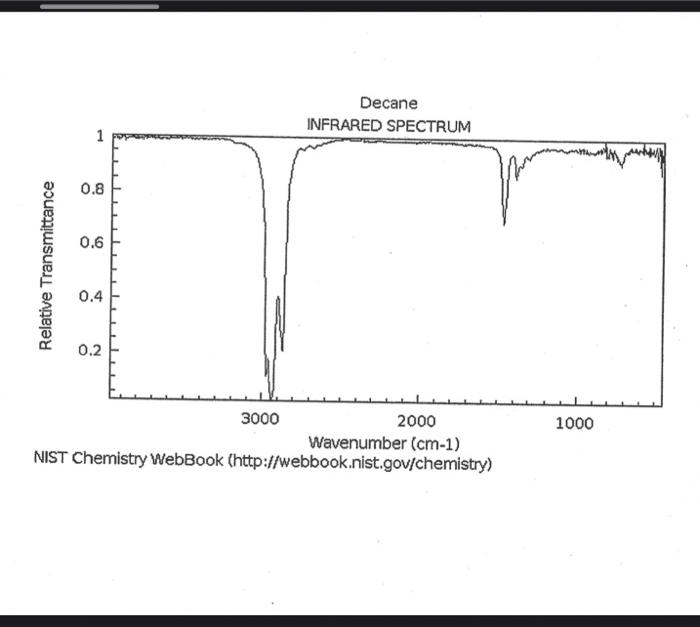
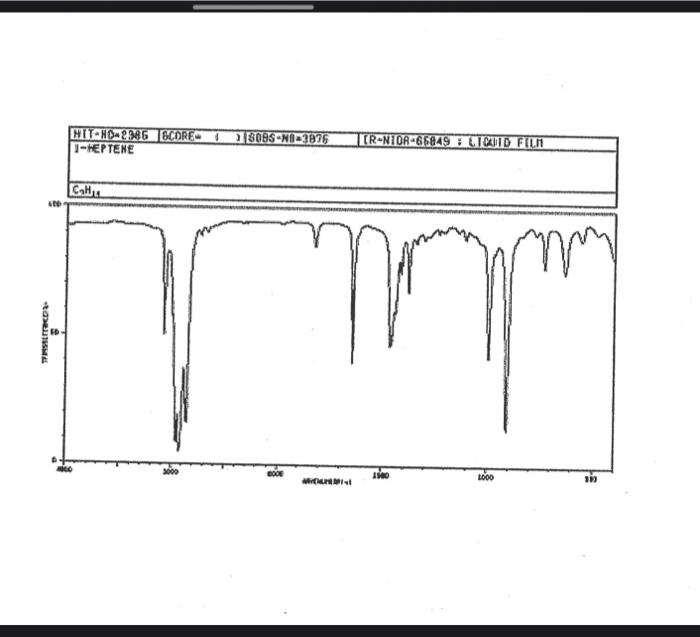
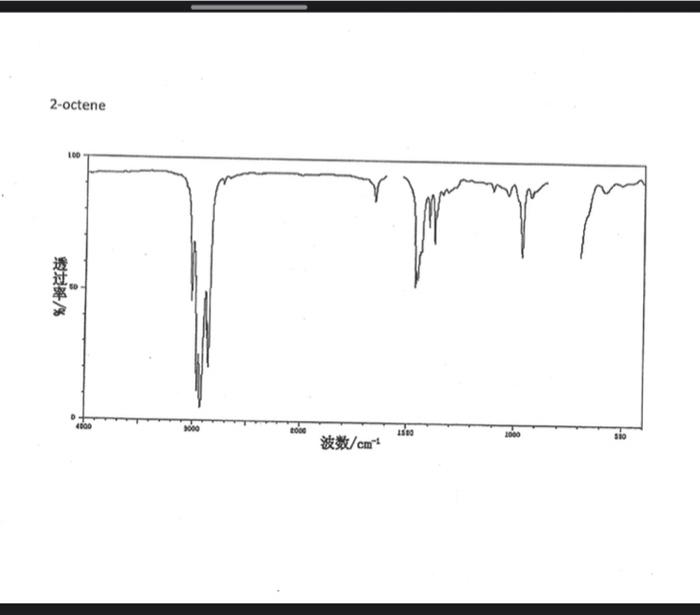
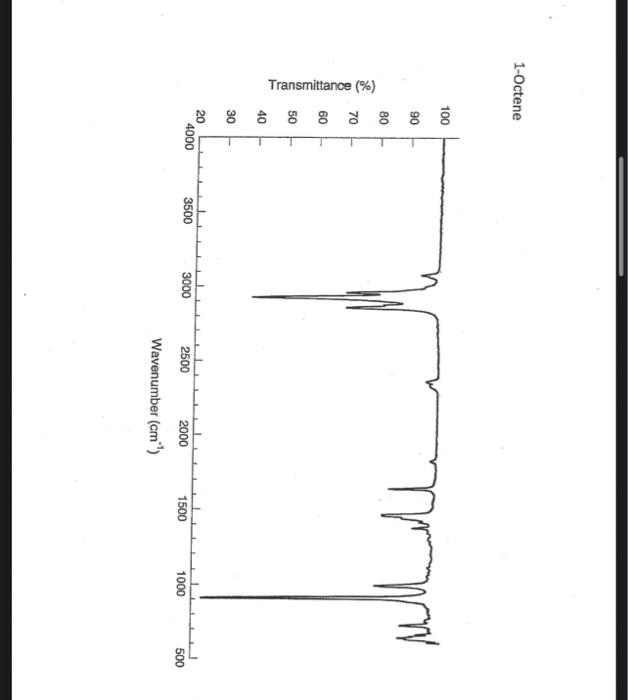
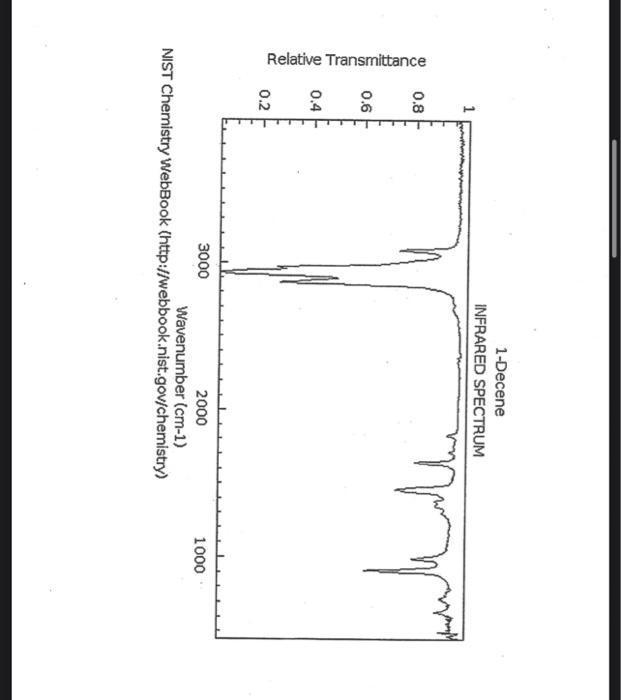
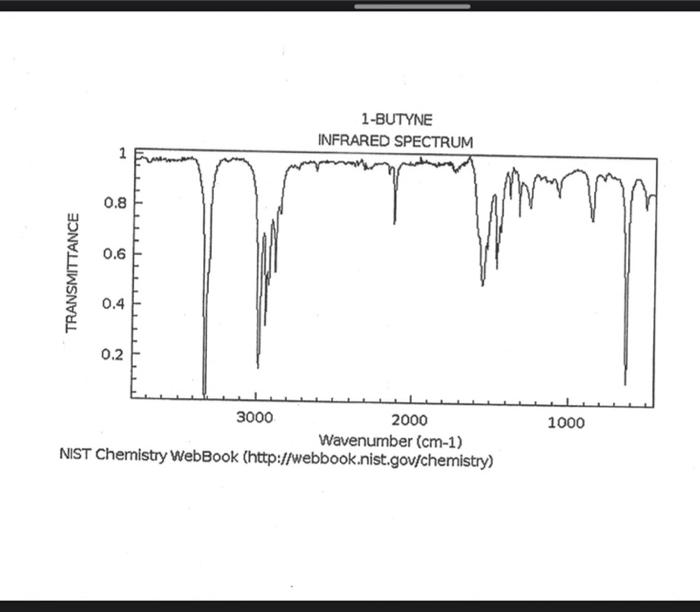
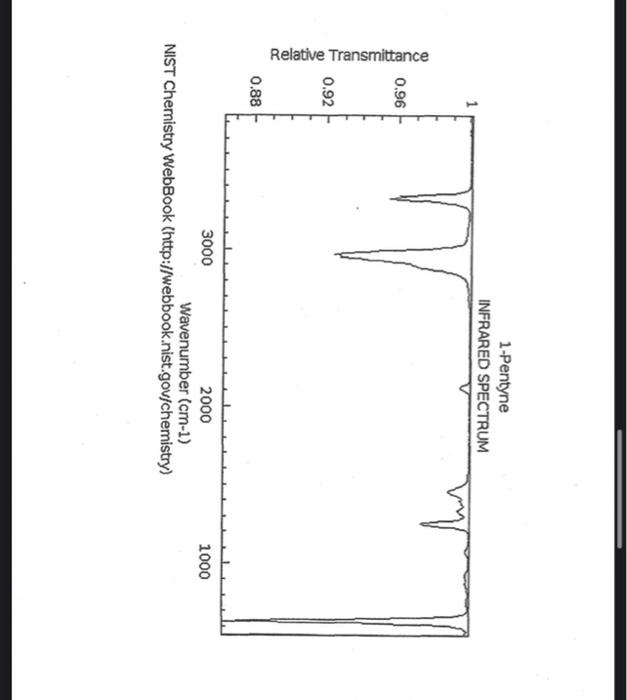
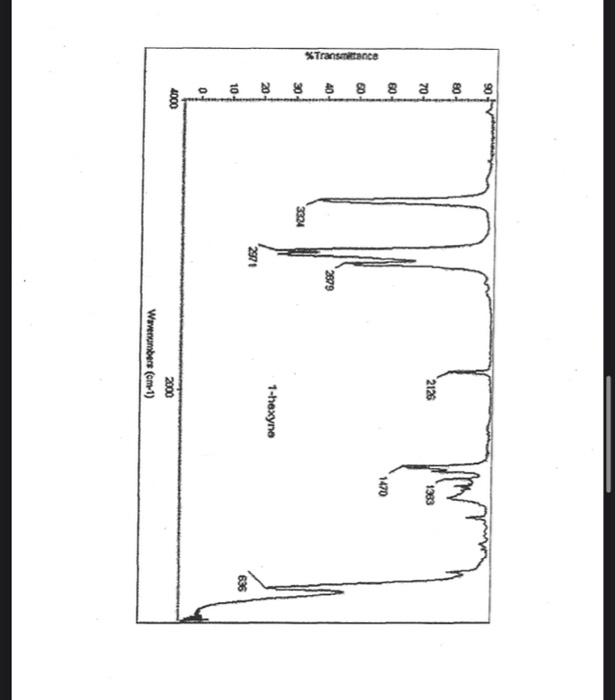
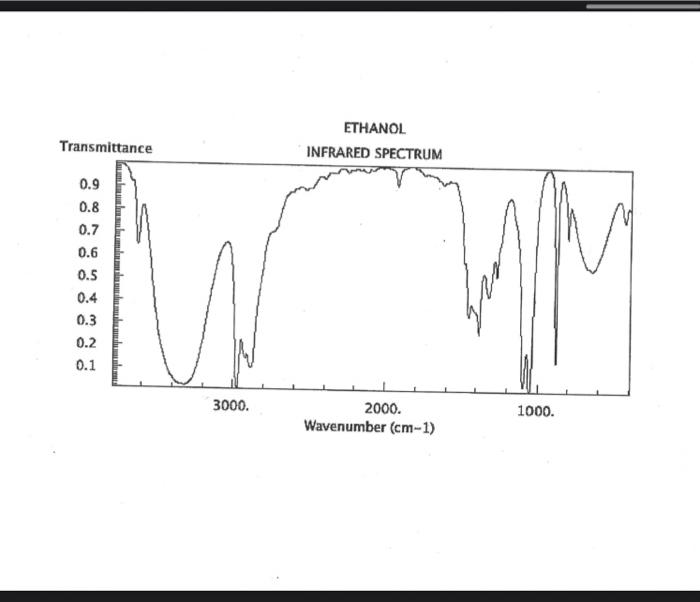
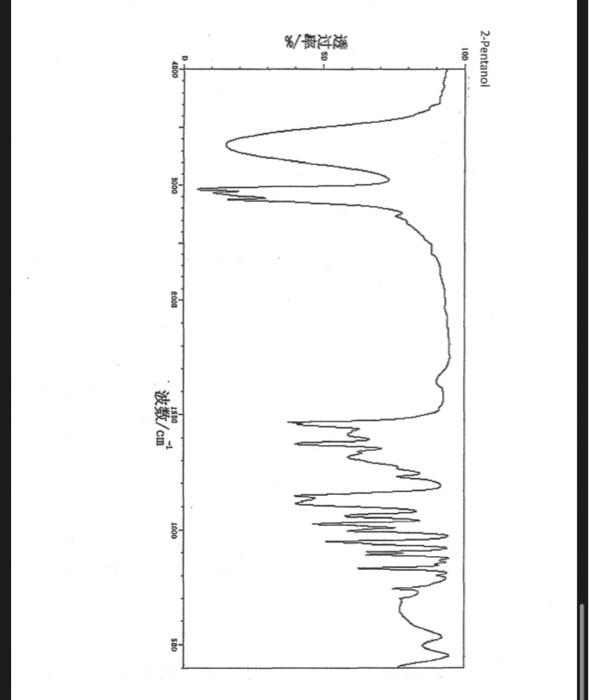
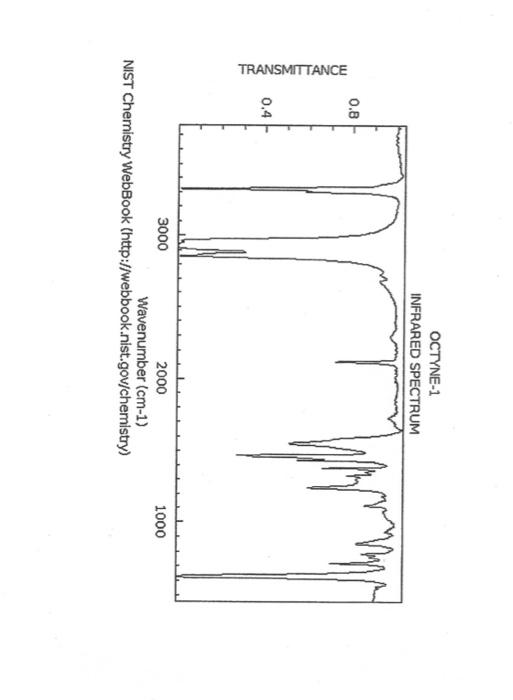
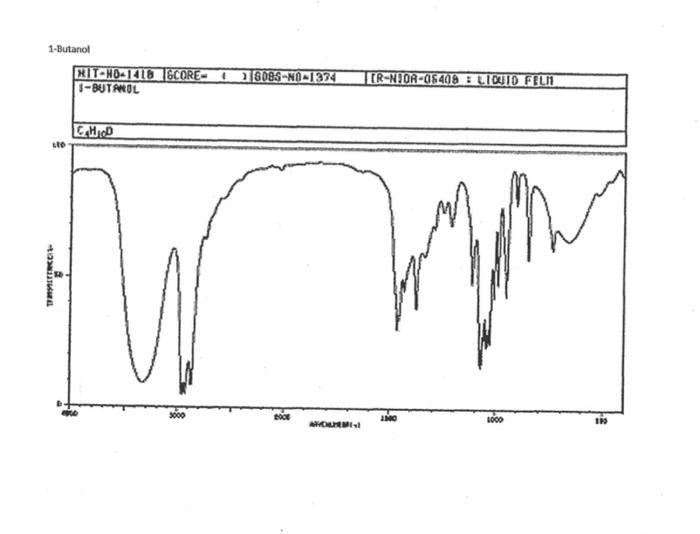
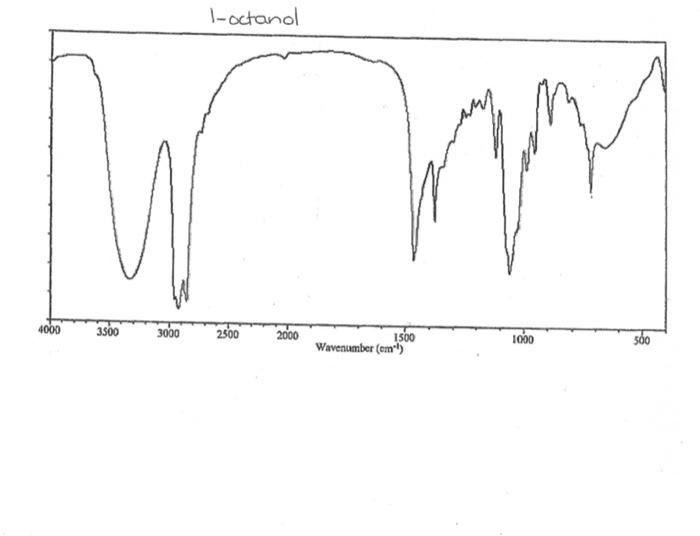
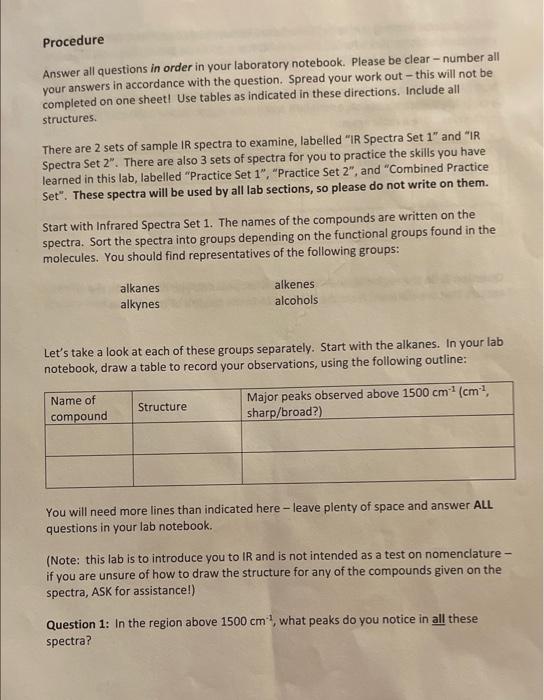
alkane Did you notice a strong (i.e. large) absorbance between 2840 and 3000 cm*? This is the characteristic absorbance for an alkane sp C-H bond. As we are dealing with organic chemistry here, that peak will appear in almost all IR spectra (Why?) Now take a look at the alkene spectra. Again, draw the structures for the compounds in a table in your lab notebook, and take a look in the region above 1500 cm for any similarities. Use a table again: Name of Major peaks observed above 1500 cm (cm, compound Structure sharp/broad?) Question 2: In the region above 1500 cm', what peaks do you notice in all these spectra that are different from the peaks seen in the spectra of the alkanes? chtiminal alky 41 alkenes Did you notice a sharp peak (on the upper edge of the alkane C-H peak) between 3050 and 3150 cm as well as a small peak between 1620-1680 cm? These two peaks are for the sp?C-H bond (3050-3150) and for the CC bond (1620-1680) Now take a look at the spectra of the alkynes. Yet again, draw the structures for the compounds in your lab notebook using a table, and take a look in the region above 1500 cm Name of compound Structure Major peaks observed above 1500 cm (cm, sharp/broad?) Question 3: In the region above 1500 cm, what peaks do you notice in all these spectra that are different from the peaks seen in the spectra of the alkanes and alkenes? JJJJJJJJJJJJJJJJJJJJJJJIINU allowinie Did you notice a peak between 3260 and 3330 cm (alkyne C-H bond). These two peaks are for the sp C-H bond (3260-3330 cm-) and for the CC bond (2100-2260 cm) Let's move on to the alcohols. This one should be easy. Yet again, draw the structures for the compounds in a table your la notebook and take a look at the spectra. Name of Structure compound Major peaks observed above 1500 cm (cm, sharp/broad?) Question 4: What new peak(s) do you notice here? alcho Did you notice the broad, strong peak between 3200cm and 3650 cm-?? That is characteristic of the O-H bond. Did you notice a peak between 3260 and 3330 cm (alkyne C-H bond). These two peaks are for the sp C-H bond (3260-3330 cm-2) and for the CC bond (2100-2260 cm) Let's move on to the alcohols. This one should be easy. Yet again, draw the structures for the compounds in a table your lab notebook and take a look at the spectra. Name of compound Structure Major peaks observed above 1500 cm (cm, sharp/broad?) Question 4: What new peak(s) do you notice here? Did you notice the broad, strong peak between 3200cm and 3650 cm?? That is characteristic of the O-H bond. colech HIT-NO-1844 SCORE ! 2.2.4-TRIMETHYLPENTANE SOBS-NO-2353 IR-NIDA-06339 : LIQUID FILM CHO 100 TISTE 10 4000 3000 0000 1000 F 360 HAVENUH 3886 64 3189 77 2959 4 2904 9 2872 10 2747 90 2217 64 2694 77 2632 1 1463 15 1994 24 1885 34 1958 14 1363 35 1203 64 1248 41 1207 40 1169 47 1113 86 1108 86 1998 84 980 53 928 74 063 84 827 04 745 85 Octane 4000 3000 2000 NAVENUMERI 1500 1000 -a Decane INFRARED SPECTRUM 1 0.8 0.6 0.4 0.2 3000 2000 Wavenumber (cm-1) NIST Chemistry WebBook (http://webbook.nist.gov/chemistry) Relative Transmittance 1000 -RODRUTISMEEL LED HIT-NO-2346 SCORE 1-HEPTENE CH 18095-NO-3876 [R-NIOR-65849 LICUID FILM mr BOOK 1500 MYCH 1000 110 2-octene non /% 1000 tood 18:00 1000 110 */cm 1-Octene 100 90 m mm 80 70 Transmittance (%) 60 50 40 30 20 4000 3500 3000 2500 1500 1000 500 2000 Wavenumber (cm) 1-BUTYNE INFRARED SPECTRUM 1 0.8 0.6 0.4 0.2 3000 2000 Wavenumber (cm-1) NIST Chemistry WebBook (http://webbook.nist.gov/chemistry) TRANSMITTANCE 1000 1-Pentyne INFRARED SPECTRUM 0.96 n 0.92 0.88 3000 2000 Wavenumber (cm-1) NIST Chemistry WebBook (http://webbook.nist.gov/chemistry) Relative Transmittance my 1000 90 80 2125 1383 70 80 1470 80 Transance 836 40 2879 30 3004 20 1-hexyno 2971 10 0-1 4000 2000 Weverombers (on-1) Transmittance ETHANOL INFRARED SPECTRUM 0.9 0.8 0.7 0.6 0.5 0.4 0.3 0.2 0.1 3000. 2000. Wavenumber (cm-1) 1000. 2-Pentanol 100 /% 4000 3000 2000 1500 1000 /c 500 OCTYNE-1 INFRARED SPECTRUM 0.8 TRANSMITTANCE 0.4 1000 3000 2000 Wavenumber (cm-1) NIST Chemistry WebBook (http://webbook.nist.gov/chemistry) 1-Butanol HIT-HD-1418 GCORE- 8085-N0-1374 1- BUTANOL [R-NOR-08498 : L1000 FILL CHAL LO 3000 too MO 100 OM IN l-octanol W 4000 3500 3000 2500 2000 1500 Wavenumber(cm) 1000 500 Procedure Answer all questions in order in your laboratory notebook. Please be clear-number all your answers in accordance with the question. Spread your work out this will not be completed on one sheet! Use tables as indicated in these directions. Include all structures. There are 2 sets of sample IR spectra to examine, labelled "IR Spectra Set 1" and "IR Spectra Set 2". There are also 3 sets of spectra for you to practice the skills you have learned in this lab, labelled "Practice Set 1", "Practice Set 2", and "Combined Practice Set". These spectra will be used by all lab sections, so please do not write on them. Start with Infrared Spectra Set 1. The names of the compounds are written on the spectra. Sort the spectra into groups depending on the functional groups found in the molecules. You should find representatives of the following groups: alkanes alkynes alkenes alcohols Let's take a look at each of these groups separately. Start with the alkanes. In your lab notebook, draw a table to record your observations, using the following outline: Name of compound Structure Major peaks observed above 1500 cm (cm 1, sharp/broad?) You will need more lines than indicated here - leave plenty of space and answer ALL questions in your lab notebook. (Note: this lab is to introduce you to IR and is not intended as a test on nomenclature - if you are unsure of how to draw the structure for any of the compounds given on the spectra, ASK for assistance!) Question 1: In the region above 1500 cm', what peaks do you notice in all these spectra
