Question
all answers must be supported by your work and rounded off as directed. Submit photos or a scan of your completed work Use the following
all answers must be supported by your work and rounded off as directed. Submit photos or a scan of your completed work
Use the following data to answer the first two questions. The test scores for a sample of five randomly chosen students are 84, 78, 87, 93, and 78.
1. What are the mean, median, and mode test scores (to nearest 0.1) for this sample of students?
2. What is the standard deviation (to nearest 0.1) of test scores for this sample of students?
Answer the next two questions using the following table. The table shows responses of 125 people to the question of whether they prefer Black Tea or Green Tea coffee or neither.
Black TeaGreen TeaNeitherTotal
Male40152580
Female152010 45
Total553535 125
3. What is the probability (to nearest 0.01) that a randomly selected person prefers Green Tea?
4. If one person is randomly selected, what is the probability (to nearest 0.01) that the person is BOTH Female AND prefers Black Tea?
Use the following information to answer the next three questions. A bag contains four different balls colored Red, White, Blue, and Green. You cannot see into the bag and you cannot tell the balls apart by feel.
5. If three balls are selected at random without replacement, how many different permutations are possible?
6. If three balls are selected at random without replacement, how many combinations are possible?
7. If three balls are selected at random with replacement, what is the probability (to nearest 0.0001) of NOT getting Green on any of the picks?
Use the following information to answer the next two questions. Assume M&M candies are randomly selected and grouped in bags of 35 pieces per bag and that 20% of all M&Ms are Blue.
8. What are the mean and standard deviation (to nearest 0.1) of the number of Blue pieces per bag? {You may consider this to be a binomial probability distribution.]
9. What is the probability (to nearest 0.0001) of finding exactly seven Blue M&Ms in any one bag?
10. The High Mileage Tire company manufactures a particular tire model that has a mean lifetime of 70,000 miles with a standard deviation of 5000 miles. The lifetimes are normally distributed. What is the probability (to nearest 0.0001) that one of these tires selected at random will last 74,000 miles or more?
11. A farmer has a flock of 100 chickens with weights that are normally distributed with a mean of 5.00 pounds and a standard deviation of 0.36 pounds. If four chickens are selected at random, what is the probability (to nearest 0.0001) that the mean weight of the group of four chickens is greater than 5.20 pounds?
12. A pollster wants to conduct a pre-election poll with a margin of error of 4.0% and a 95% confidence level. The pollster does not know ahead of time what the proportion in favor of either candidate is. How many people must be included in the sample to achieve the goal of a 4.0% margin of error? [Note that p -hat is unknown and is therefore assumed to be 0.5.]
13. In another pre-election poll, a pollster finds that 405 out of 600 people polled favor Smith. Construct the 95% confidence interval for the proportion (to nearest 0.001) of people in the whole population who favor Smith.
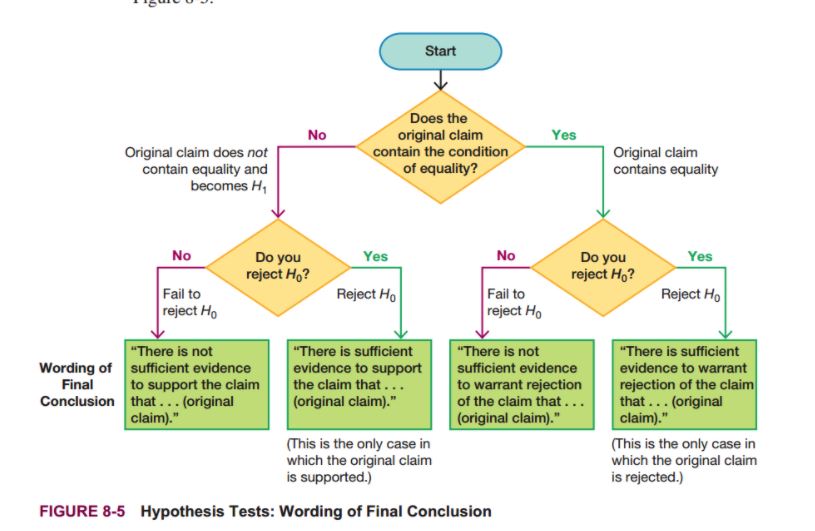
14. An original claim is made that more than 50% of American consumers are not comfortable with the use of drone delivery for merchandise. Hypothesis testing results in Rejection of the Null hypothesis. Using Figure 8-5 on page 366 of the text, clearly state the final conclusion reached from this hypothesis test.
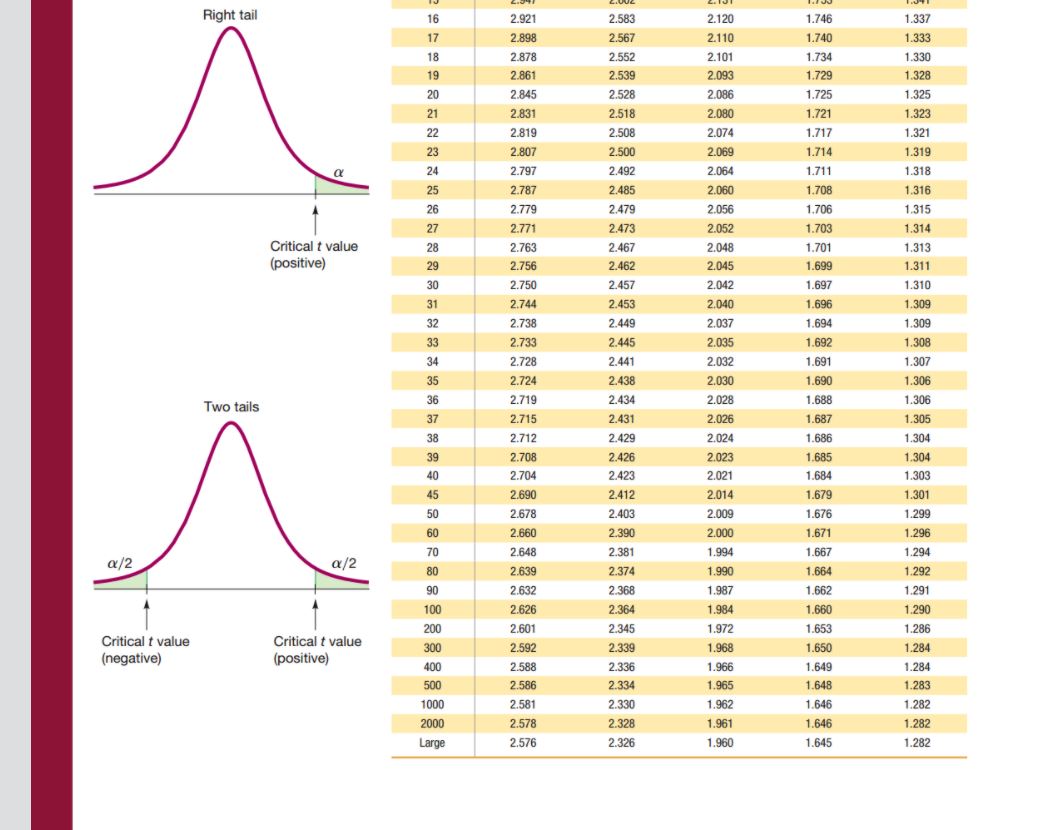
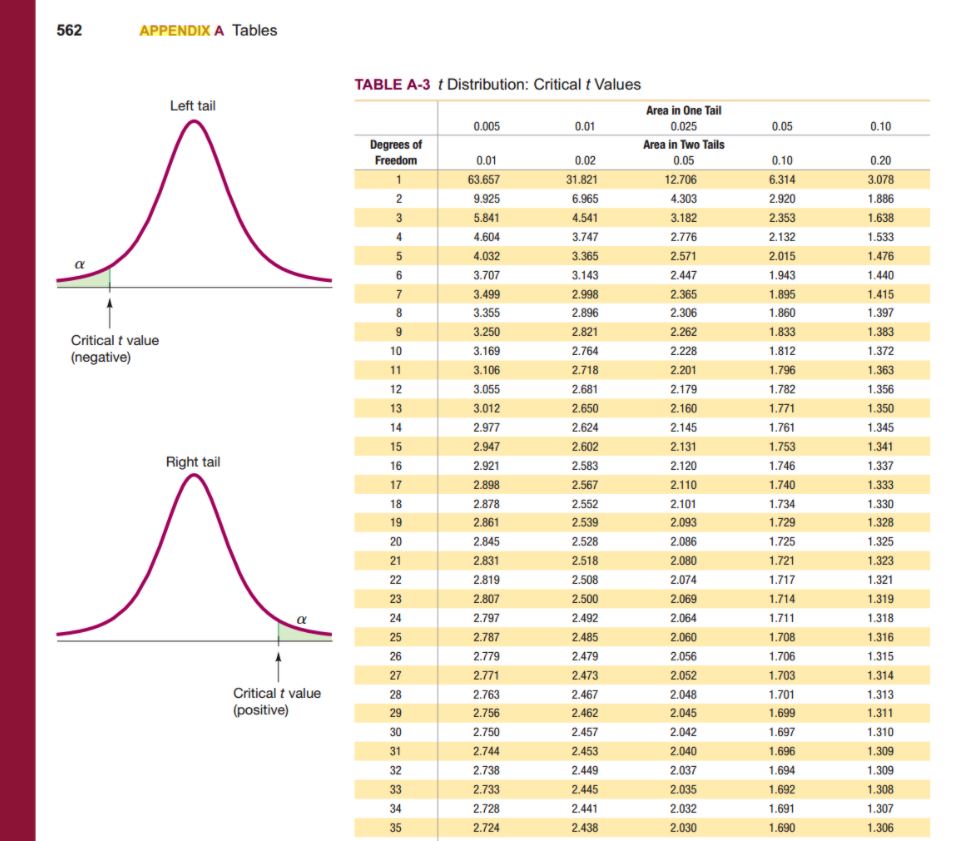
15. A hypothesis test with a 5% level of significance is designed to test the claim that the mean weight of a new breed of chickens is greater than 6.00 pounds. A sample of 36 chickens is obtained and their mean weight is 6.10 pounds with a sample standard deviation of 0.35 pounds. No information is available concerning the standard deviation of the whole population of the new breed. What is the critical value (from Table A-3) and the test statistic (to nearest 0.001) for this hypothesis test?


Step by Step Solution
There are 3 Steps involved in it
Step: 1

Get Instant Access to Expert-Tailored Solutions
See step-by-step solutions with expert insights and AI powered tools for academic success
Step: 2

Step: 3

Ace Your Homework with AI
Get the answers you need in no time with our AI-driven, step-by-step assistance
Get Started


