ALL Charts are in the pictures
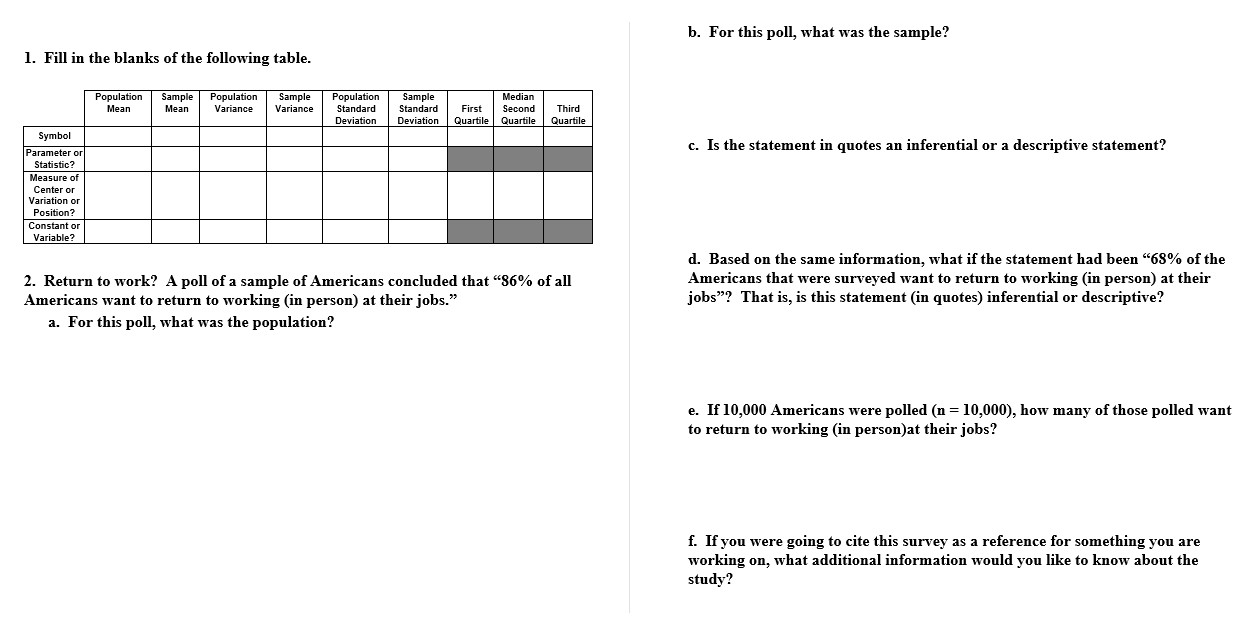
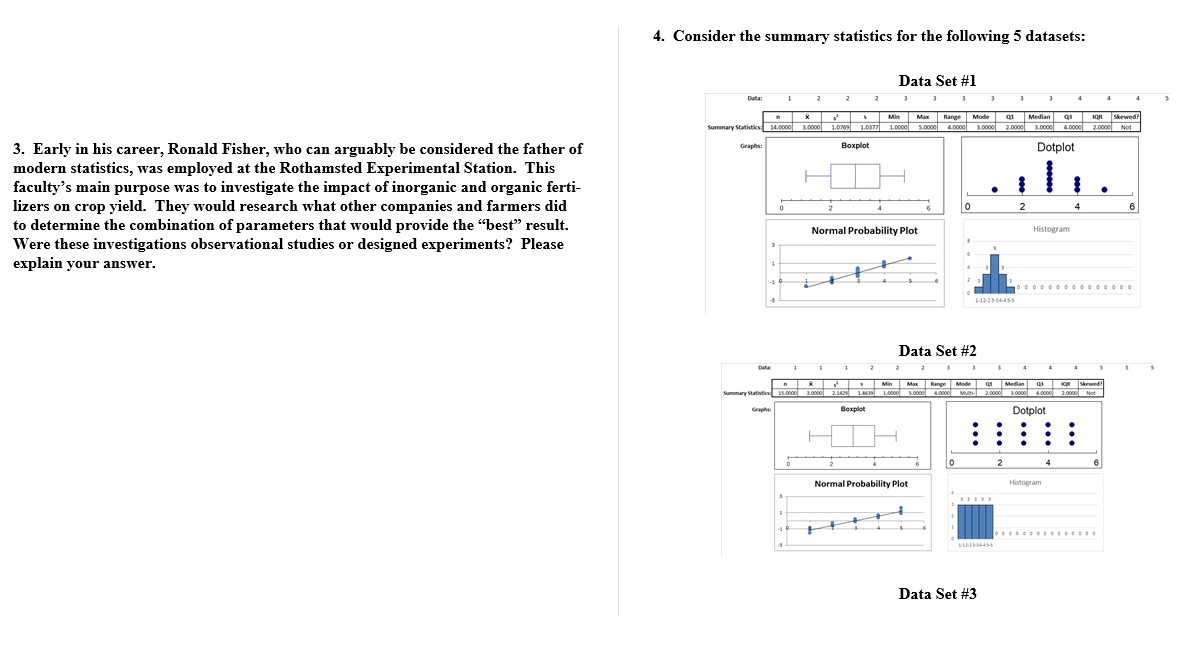
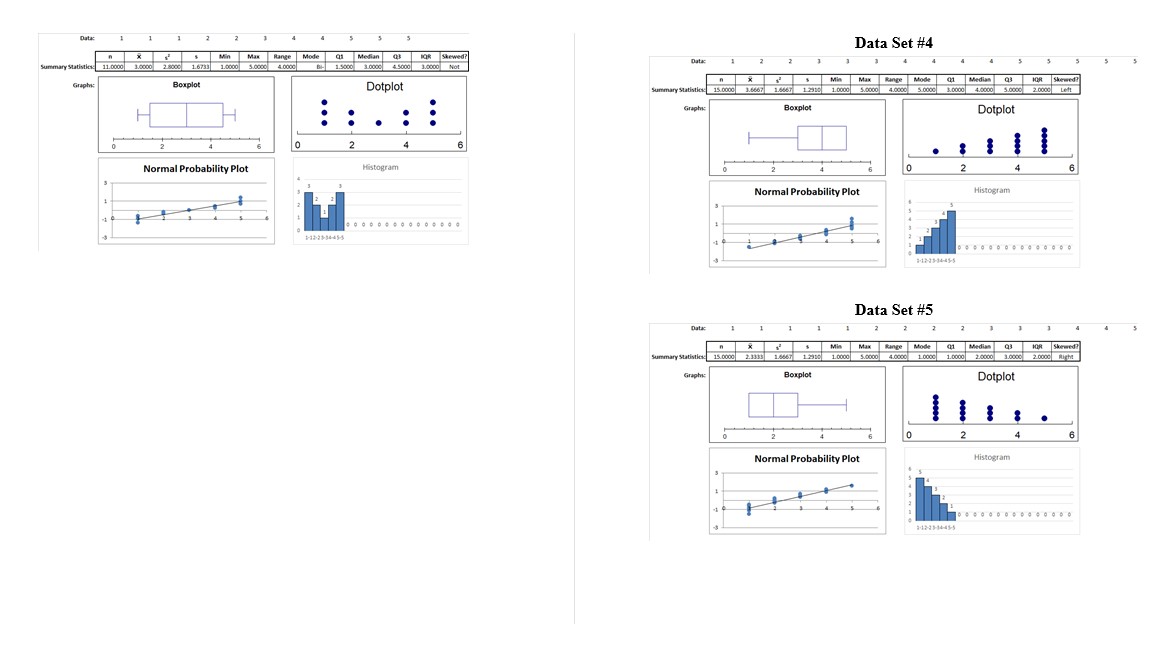
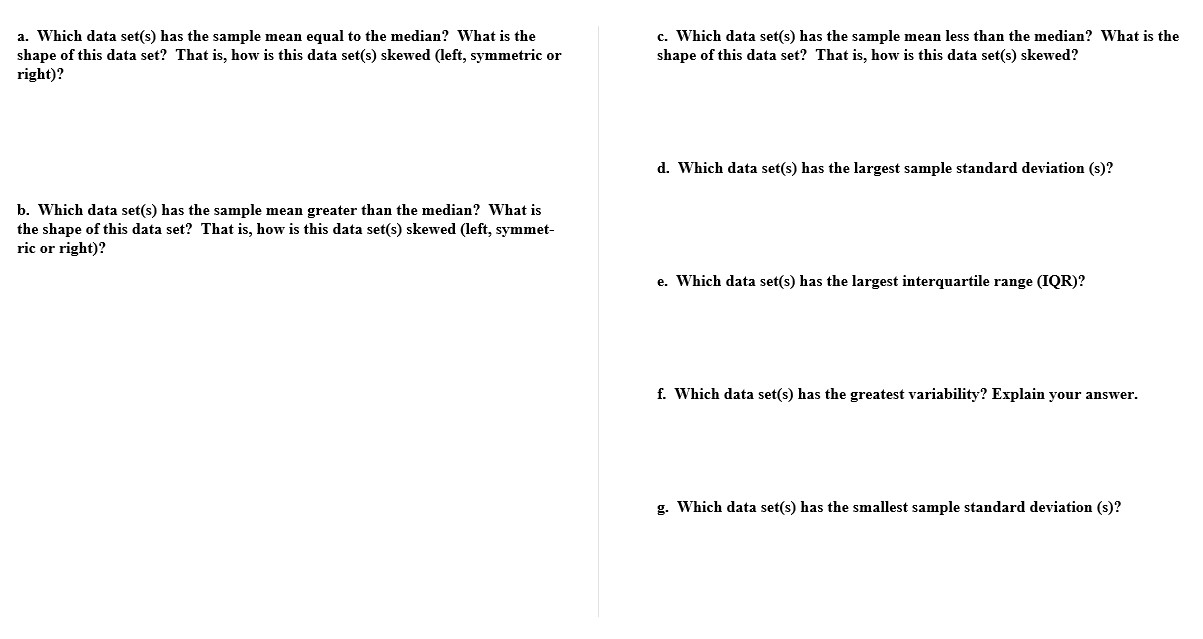
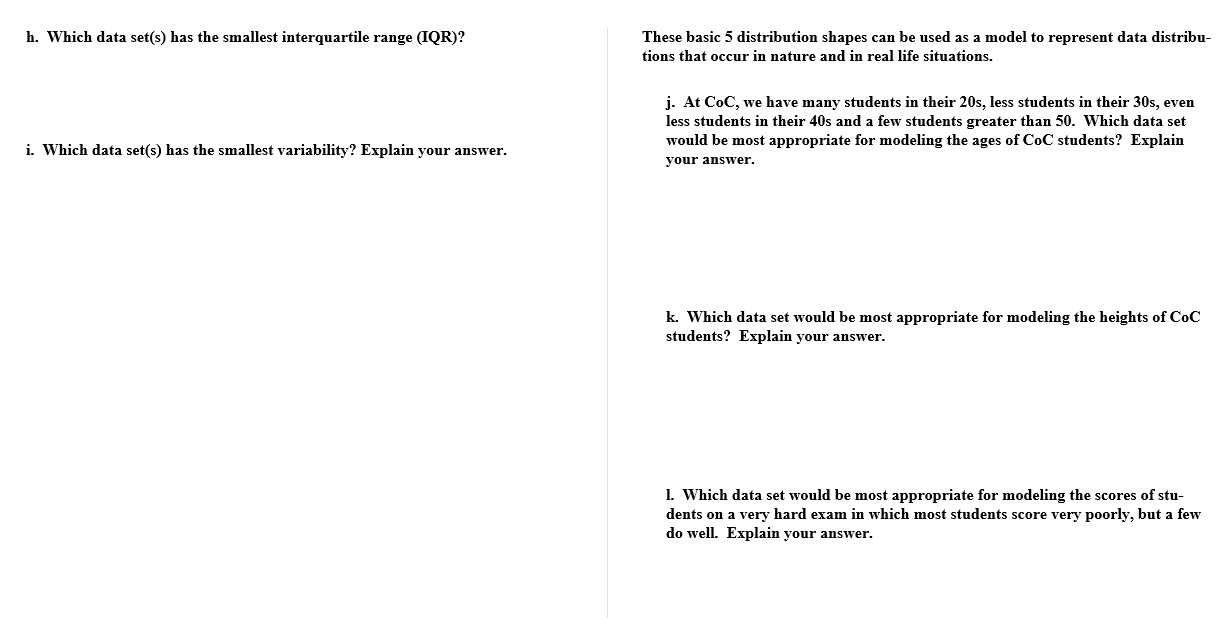
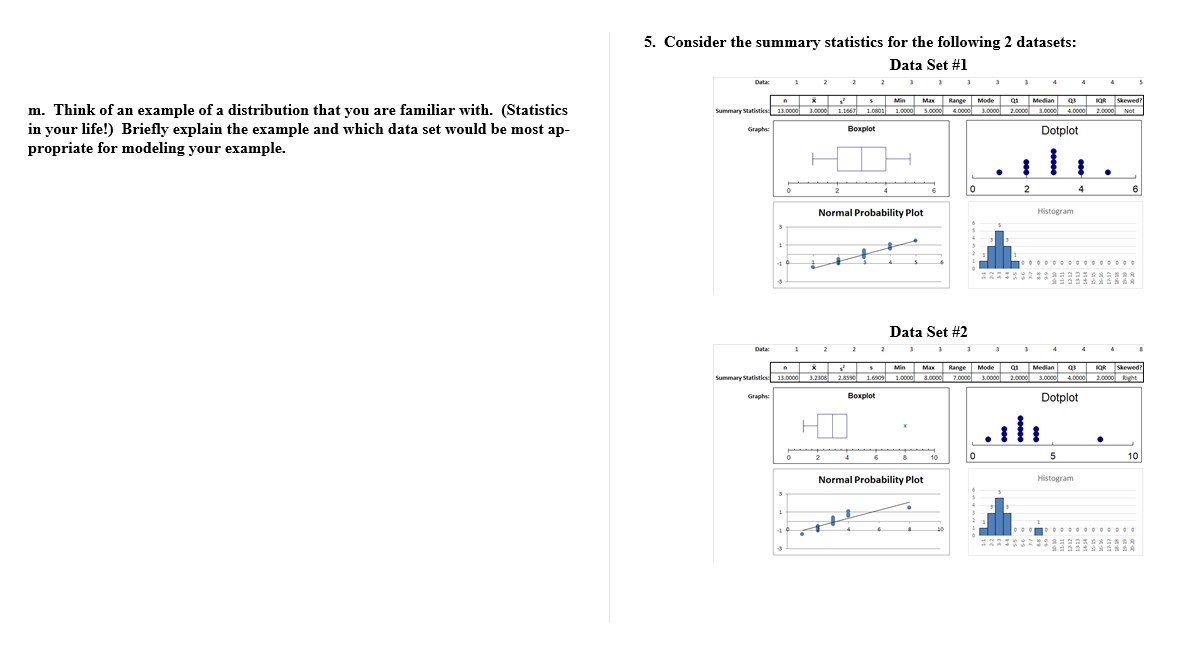
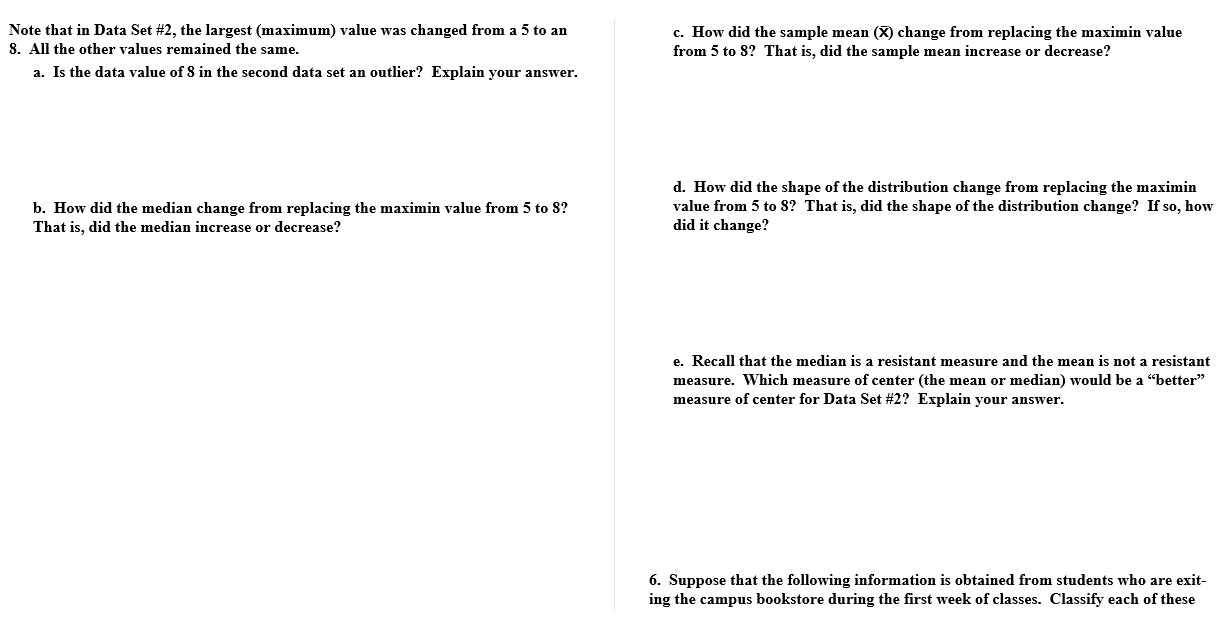
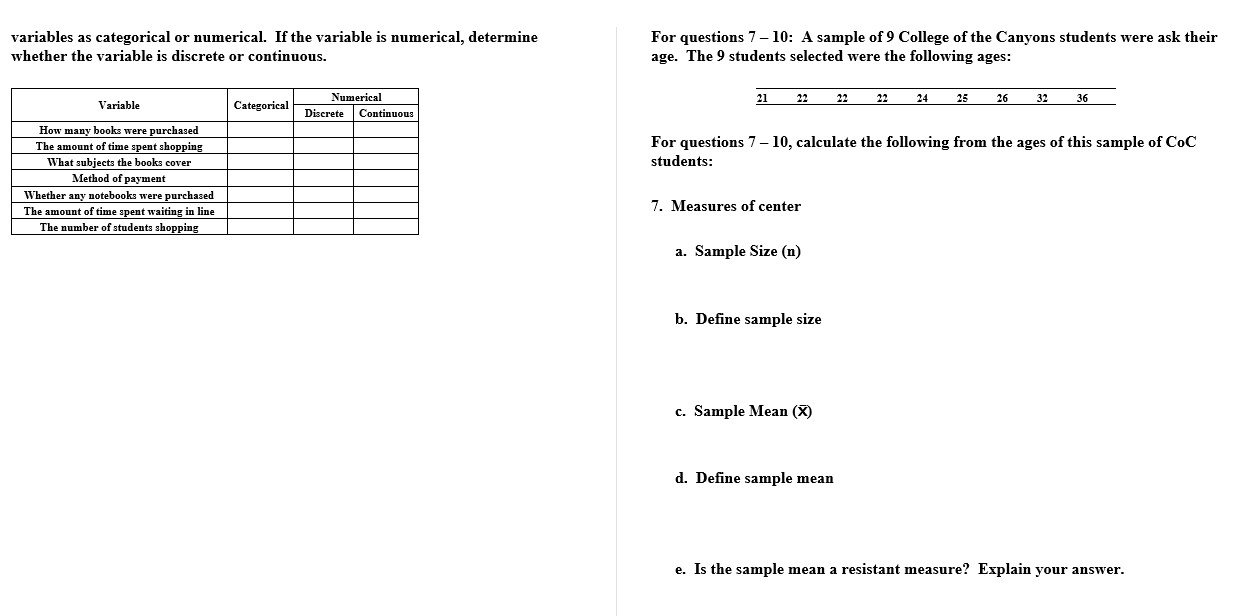
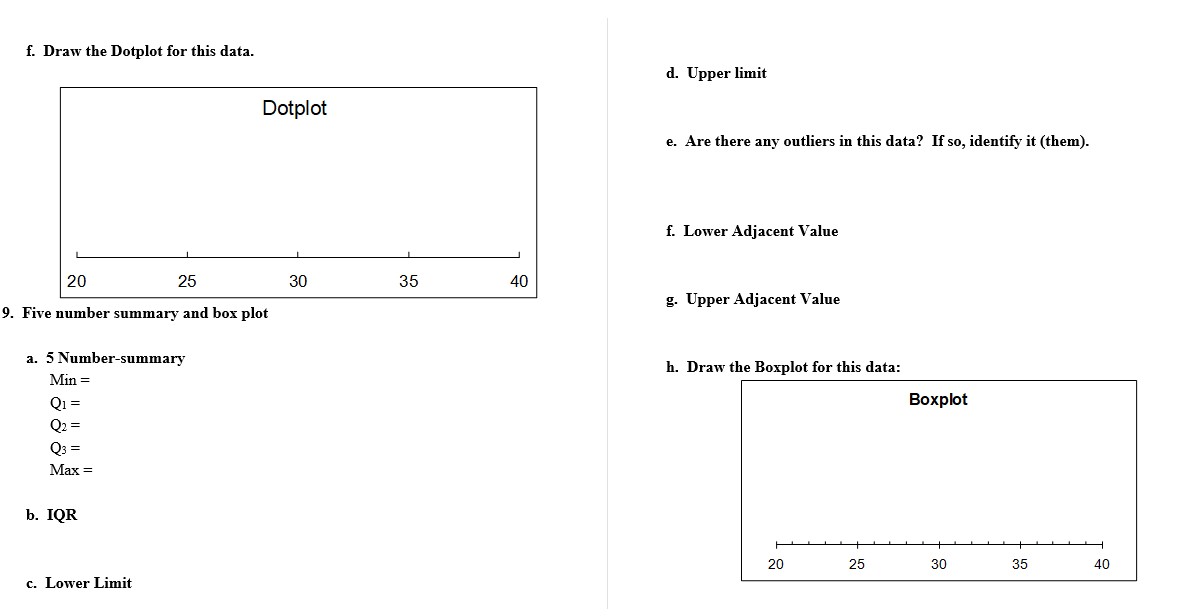
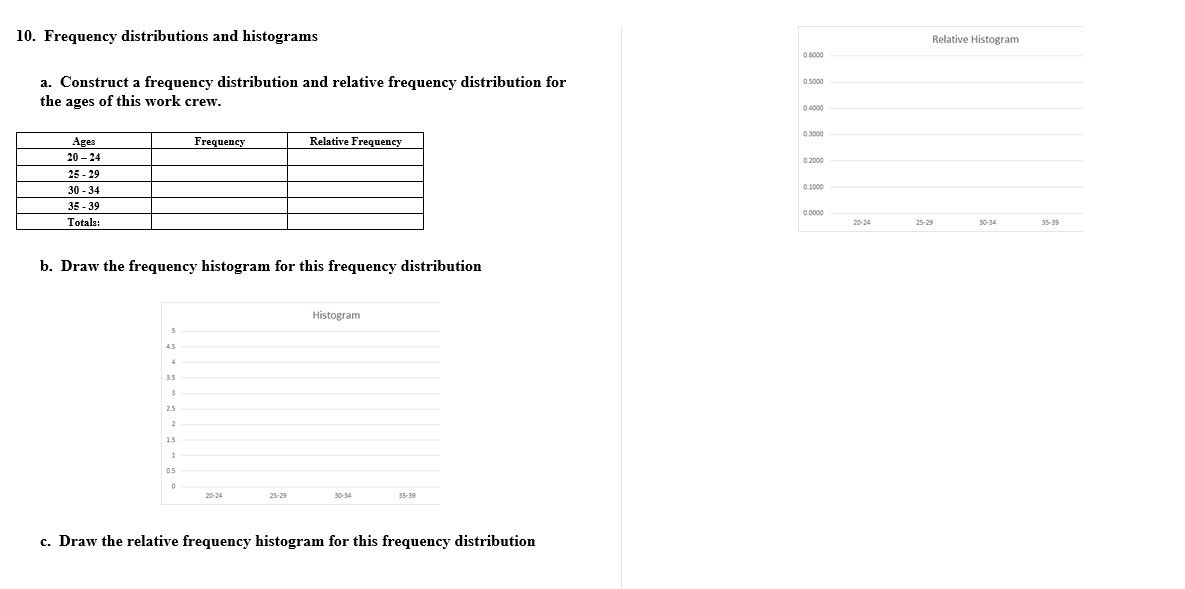
b. For this poll, what was the sample? 1. Fill in the blanks of the following table. Population Sample Population Sample Population Sample Median Mean Mean Variance Variance Standard Standard First Second Third Deviation Deviation Quartile Quartile Quartile Symbol c. Is the statement in quotes an inferential or a descriptive statement? Parameter or Statistic? Measure of Center or Variation or Position? Constant or Variable? d. Based on the same information, what if the statement had been "68% of the 2. Return to work? A poll of a sample of Americans concluded that "86% of all Americans that were surveyed want to return to working (in person) at their Americans want to return to working (in person) at their jobs." jobs"? That is, is this statement (in quotes) inferential or descriptive? a. For this poll, what was the population? e. If 10,000 Americans were polled (n = 10,000), how many of those polled want to return to working (in person)at their jobs? f. If you were going to cite this survey as a reference for something you are working on, what additional information would you like to know about the study?4. Consider the summary statistics for the following 5 datasets: Data Set #1 in Min Max Range Mode 41 Median 10A Joewed? Summary Stathtics: kest woop Woop0 109 10377 10900 50900 40900 80OR0 20090 200:|60909 2000% Not 3. Early in his career, Ronald Fisher, who can arguably be considered the father of Graphs: Boxplot Dotplot modern statistics, was employed at the Rothamsted Experimental Station. This faculty's main purpose was to investigate the impact of inorganic and organic ferti- lizers on crop yield. They would research what other companies and farmers did 0 B to determine the combination of parameters that would provide the "best" result. Normal Probability Plot Histogram Were these investigations observational studies or designed experiments? Please explain your answer. Data Set #2 tuts Min Max Range Mode Q1 Median qp| Showed 20 Boxplot Dotplot 2 Normal Probability Plot Histogram Data Set #3Datac Data Set #4 Min Max Range Mode Q1 Median k Skewed? Date Summary Statistics 11.8030 1.6090 2.8306 16733 10900 3.0906 4:08030 B 1.5000 3.000 4.5000 1.0000 Hot " Min Max Range Mode 01 Medias (3 108 Sheard! Graph Boxplot Dotplot Summary Statistics 15.0000 1.6867 1.6867 1 2320 1.0000 5 4.6060 5 0000 5.0000 20000 Let H Boxplot . . . . Graphic Dotplot . . . 2 Normal Probability Plot Histogram 2 Normal Probability Plot Histogram 1 4 & Data Set #5 Datac 1 2 Min Max Range Mode 01 Medias (3 108 Skewed! Summary Statistics 15.0800 2.3285 1.8565 1 2920 10003 5.6060 4.0606 10000 1.0000 20060 1.0090 2.0000 High Graphic Bouplot Dotplot 0 2 6 Normal Probability Plot Histograma. Which data set(s) has the sample mean equal to the median? What is the c. Which data set(s) has the sample mean less than the median? What is the shape of this data set? That is, how is this data set(s) skewed (left, symmetric or shape of this data set? That is, how is this data set(s) skewed? right)? d. Which data set(s) has the largest sample standard deviation (3)? b. Which data set(s) has the sample mean greater than the median? What is the shape at this data set? That is, how is this data set(s) skewed (left, symmet ric or right)? e. Which data ses) has the largest interqnartile range (IQR)? f. Which data setis) has the greatest variability? Explain your answer. g. W'hich data set(s) has the smallest sample standard deviation (3)? h. Which data set(s) has the smallest interquartile range (IQR)? i. Which data set(s) has the smallnst variability? Explain your answer. These basic 5 distribution shapes can be used as a model to represent data distribur tious that occur in nature and in real life situations. j. At CoC, we have many students in their 205, less students in their 305, even less students in their \"Is and a few students greater than 50. Which data set would be most appropriate for modeling the ages of COC students? Explain your answer. 1:. Mick data set would be most appropriate for modeling the heights of C00: students? Explain your answer. L Mich data set would he most appropriate for modeling the scores of stur dents on a very hard exam in which most students score very poorly, but a few do well. Explain your answer. 5. Consider the summary statistics for the following 2. atasets: Data Set #1 m. Think of an example of a distribution that you are familiar with. (Statistics in your life!) Briey explain the example and which data set: would be most ap propriate for modeling your example. *3] ' .ll! . Note that in Data Set #2, the largest (maximum) value was changed from a 5 to an c. How did the sample mean (i) change from replacing the maxinlin value 8. All the other values remained the same. {111m 5 to 8? That is, did the sample mean increase or decrease? a. Is the data value of 8 in the second data set an outlier? Explain your answer. d. How did the shape of the distribution change from replacing the maximin b. Haw did the median change from replacing the matinliu value fmm 5 to 3? value from 5 to 3? That is, did the shape of the distribution change? If so, how That is, did the median increase or decrease? did it change? e. Recall that the median is a resistant measure and the mean is not a resistant measure. Which measure of center (the mean or median) would be a \"better\" measure of center for Data Set #2? Explain your answer. 6. Suppose that the following information is obtained from students who are exit ing the campus bookstore during the rst week of classes. Classify each of these variables as categorical or numerical. If the variable is numerical, determine For questions 7-10: A sample of 9 College of the Canyons students were ask their whether the variable is discrete or continuous. age. The 9 students selected were the following ages: Numerica Variable 21 22 22 22 24 25 26 32 Categorical 36 Discrete Continuous How many books were purchased The amount of time spent shopping For questions 7- 10, calculate the following from the ages of this sample of CoC What subjects the books cover students: Method of payment Whether any notebooks were purchased The amount of time spent waiting in line 7. Measures of center The number of students shopping a. Sample Size (n) b. Define sample size c. Sample Mean (X) d. Define sample mean e. Is the sample mean a resistant measure? Explain your answer.i. Mode(s) f. Median j. Define mode g. Define median 8. Measures of variation and dot plot h. Is the median a resistant measure? Explain your answer. a. Range b. Sample Variance (s') c. Sample Standard Deviation (s) d. Define sample standard deviation e. Is the sample standard deviation a resistant measure? Explain your answer.f. Draw the Dotplot for this data. d. Upper limit Dotplot e. Are there any outliers in this data? If so, identify it (them). f. Lower Adjacent Value 20 25 30 35 40 g. Upper Adjacent Value 9. Five number summary and box plot a. 5 Number-summary h. Draw the Boxplot for this data: Min = Q1 = Boxplot Q2 = Q3 = Max = b. IQR 20 25 30 35 40 c. Lower Limit10. Frequency distributions and histograms Relative Histogram 0 6090 a. Construct a frequency distribution and relative frequency distribution for 0 5000 the ages of this work crew. 0.4030 0.3090 Age Frequency Relative Frequency 20 -24 0.2000 25 - 29 30 -34 0 1030 35 -39 0 0000 Totals 20-24 25-29 30-34 35-39 b. Draw the frequency histogram for this frequency distribution Histogram 45 3.5 25 15 05 20-24 25-29 30-34 35-39 c. Draw the relative frequency histogram for this frequency distributiond. lfyou wanted to compare the ages of this sample of CoC students 1with other samples of CoC students, would you use the freqneucy distribution and histo gram or 1would you use the relative frequency distribution and relative histo gram Explain your reasoning. e. Construct a {sorted} stemandleaf diagram for this data using two lines per stem. f. \"Thick graphical technique do prefer {box plot, dot plot:| stemandleaf, histo gram ur relative histogram} for representing this data? Please explain your an swer
