Answered step by step
Verified Expert Solution
Link Copied!

Question

1 Approved Answer

ALL O 8. Statistical Metrics (FRQ) You are ven a random sample of users that includes how many items they have purchased in their lifetime.
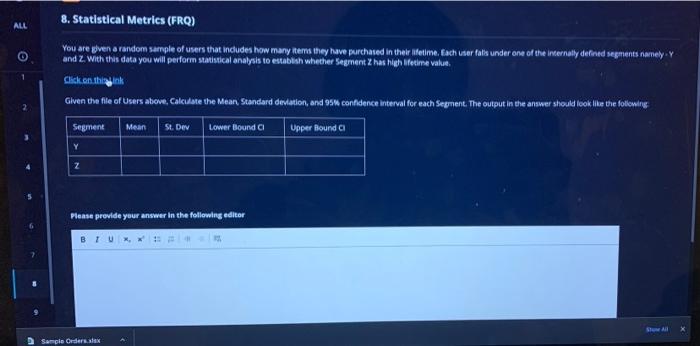
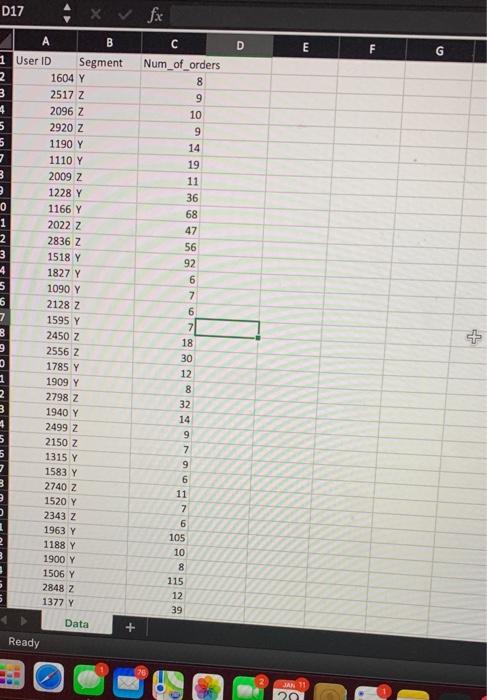
image text in transcribed
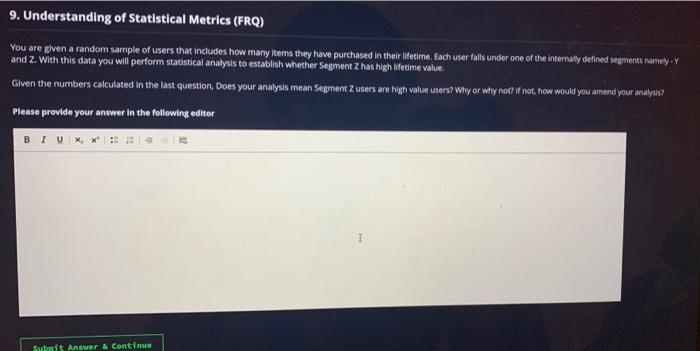
ALL O 8. Statistical Metrics (FRQ) You are ven a random sample of users that includes how many items they have purchased in their lifetime. Fachwer fats under one of the internally defined segments namely and Z. With this data you will perform statistical analysis to establish whether segment has high lifetime value Click on thighink Given the file of users above, Calculate the Mean, Standard deviation, and 95% confidence interval for each Segment. The output in the answer should look like the following Segment Mean St. Der Lower Boundai Upper Bounda Y Z Please provide your answer in the following editor San Sample Ordered D17 x fix D E F G C Num_of_orders 8 9 10 9 14 19 11 36 68 47 56 92 6 7 A B 1 User ID Segment 2 1604 Y 3 2517 Z 4 2096 Z 5 2920 Z 5 1190 Y 7 1110 Y 3 2009 Z. 2 1228 Y 0 1166 Y 1 2022 z 2 2836 Z 3 1518 Y 4 1827 Y 5 1090 Y 6 2128 Z 7 1595 Y 8 2450 Z 9 2556 Z 1785 Y 1909 Y 2798 Z 3 1940 Y 4 2499 Z 2150 Z 1315 Y 1583 Y 3 2740 Z 3 1520 Y 2343 Z 1963 Y 2 1188 Y 1900 Y 1506 Y 2848 Z 1377 Y 6 7 18 30 12 8 32 14 9 7 9 6 11 7 6 105 10 8 115 12 39 Data + Ready JAN 11 9. Understanding of Statistical Metrics (FRQ) You are given a random sample of users that includes how many items they have purchased in their lifetime. Each user falls under one of the internally defined segments namely: Y and Z. With this data you will perform statistical analysis to establish whether Segment 2 has high lifetime value. en the numbers calculated in the last question, Does your analysis mean segment 2 users are high value users? Why or why not? If not, how would you amend your analysis? Please provide your answer in the following editor BIU** Givent Submit Answer & Continue
Step by Step Solution

There are 3 Steps involved in it

Step: 1

blur-text-image

Get Instant Access to Expert-Tailored Solutions

See step-by-step solutions with expert insights and AI powered tools for academic success

Step: 2

blur-text-image

Step: 3

blur-text-image

Ace Your Homework with AI

Get the answers you need in no time with our AI-driven, step-by-step assistance

Get Started

Recommended Textbook for

More Books

Students also viewed these Databases questions

Question

a .List any function of business reports using an example.

Answered: 1 week ago