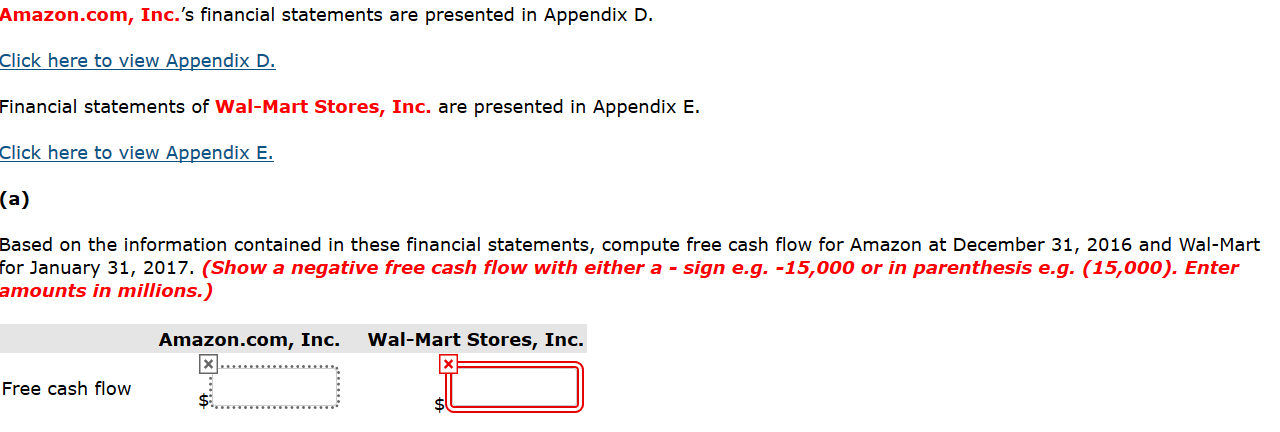
 Amazon.com, Inc.s financial statements are presented in Appendix D. Click here to view Appendix D. Financial statements of Wal-Mart Stores, Inc. are presented in Appendix E. Click here to view Appendix E. (a) Based on the information contained in these financial statements, compute free cash flow for Amazon at December 31, 2016 and Wal-Mart for January 31, 2017. (Show a negative free cash flow with either a - sign e.g. -15,000 or in parenthesis e.g. (15,000). Enter amounts in millions.) Amazon.com, Inc. Wal-Mart Stores, Inc. Free cash flow $Enter the amount in millions of dollars Entry field with incorrect answer now contains modified data $Enter the amount in millions of dollars Entry field with incorrect answer
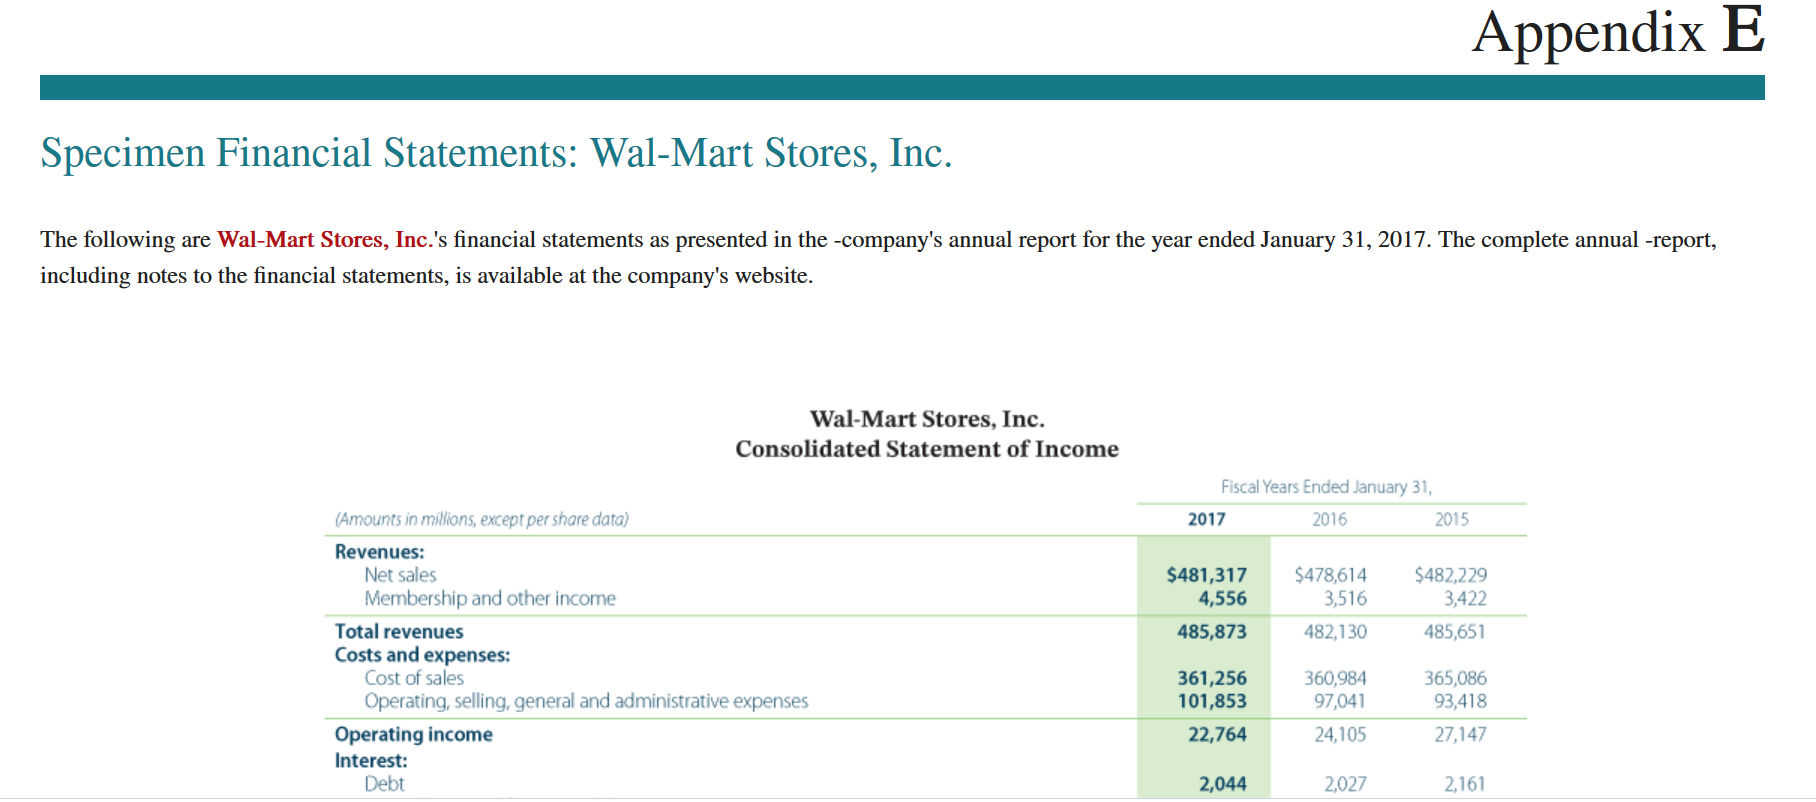
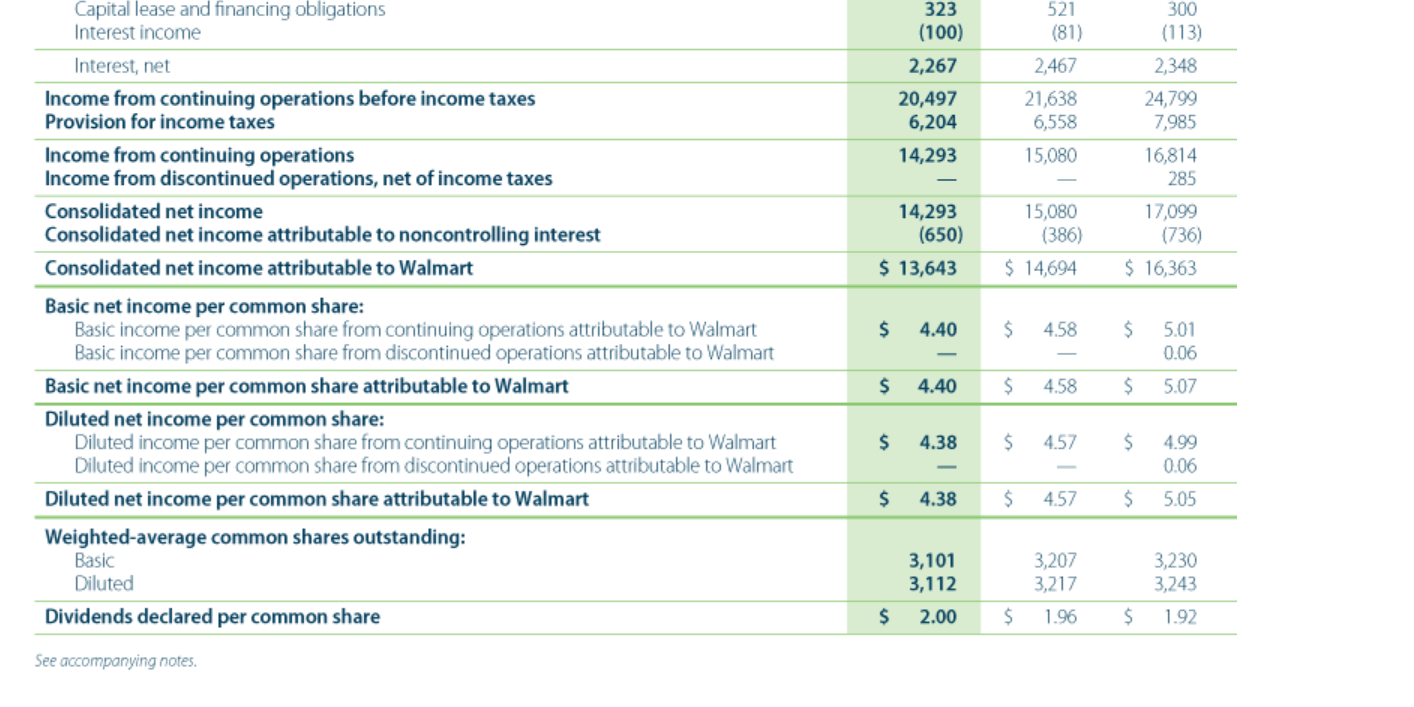
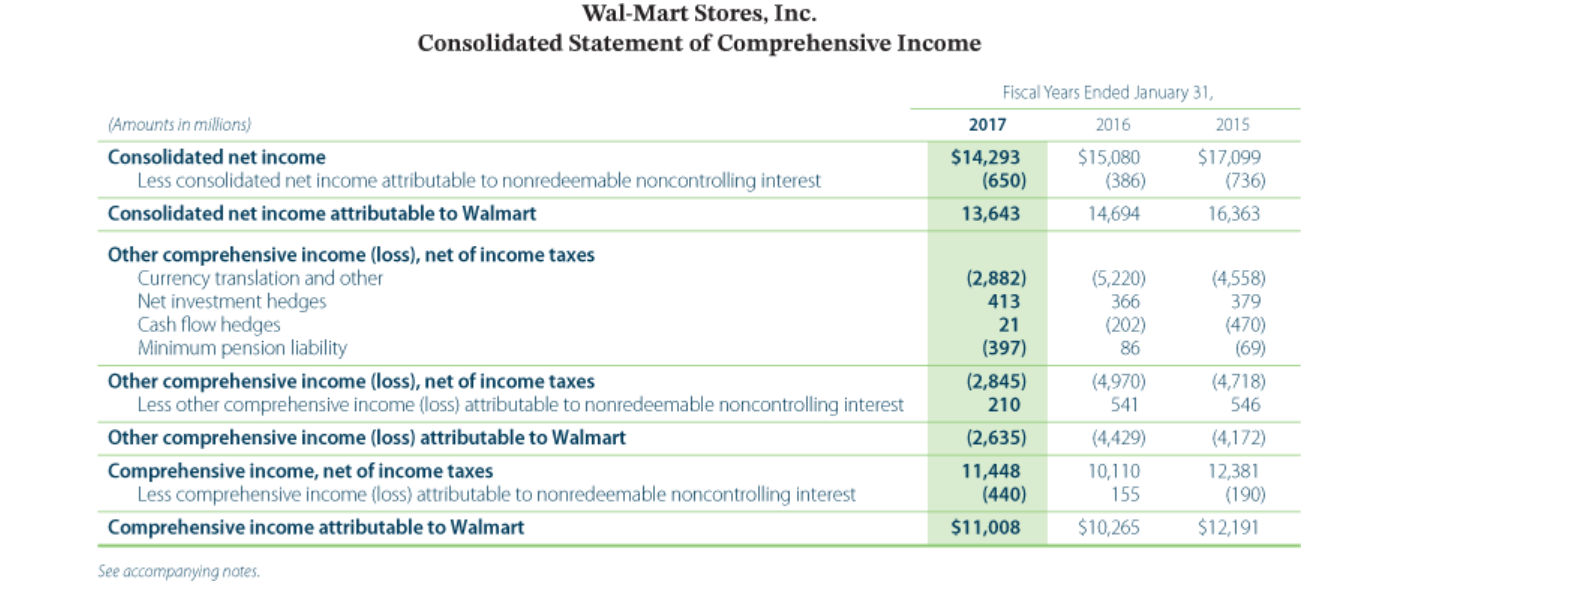
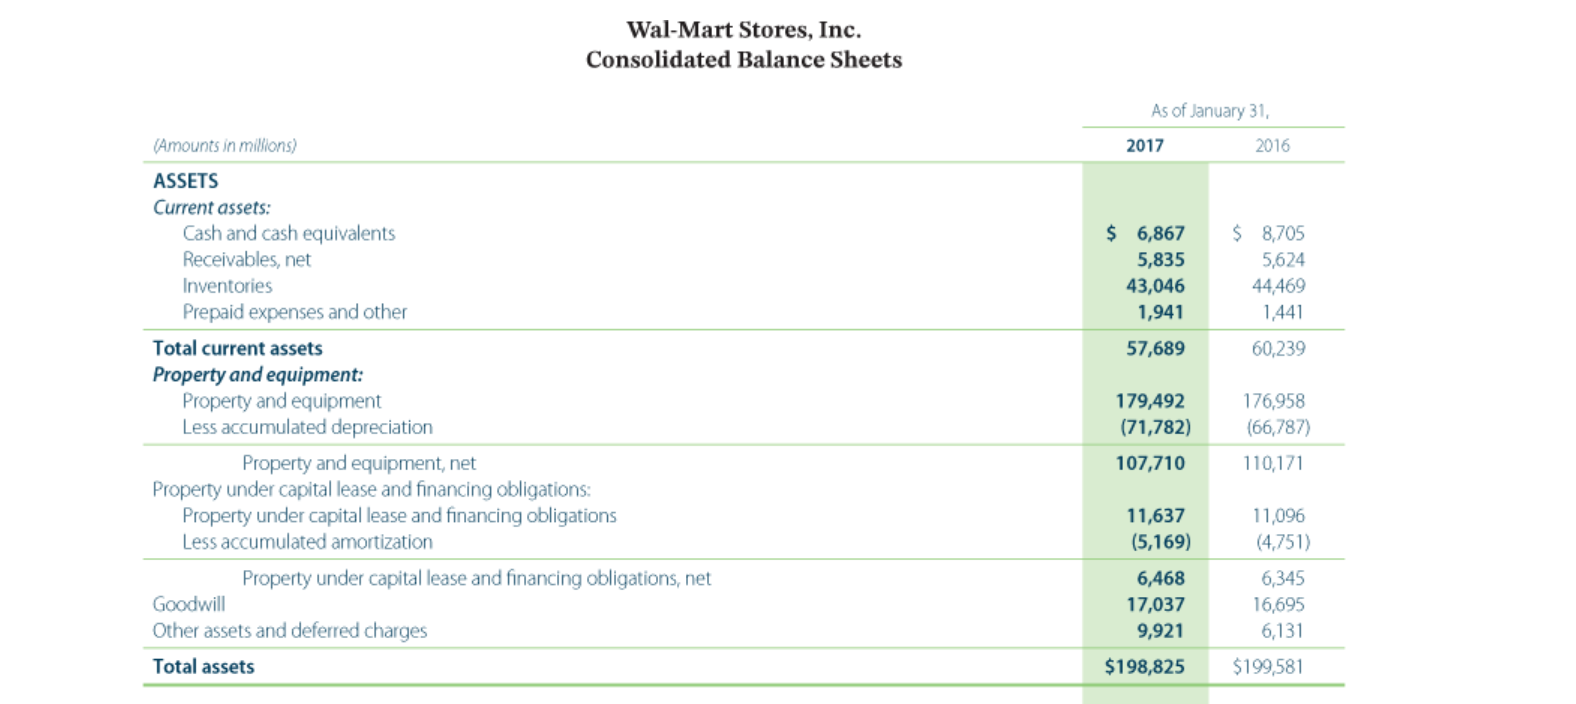
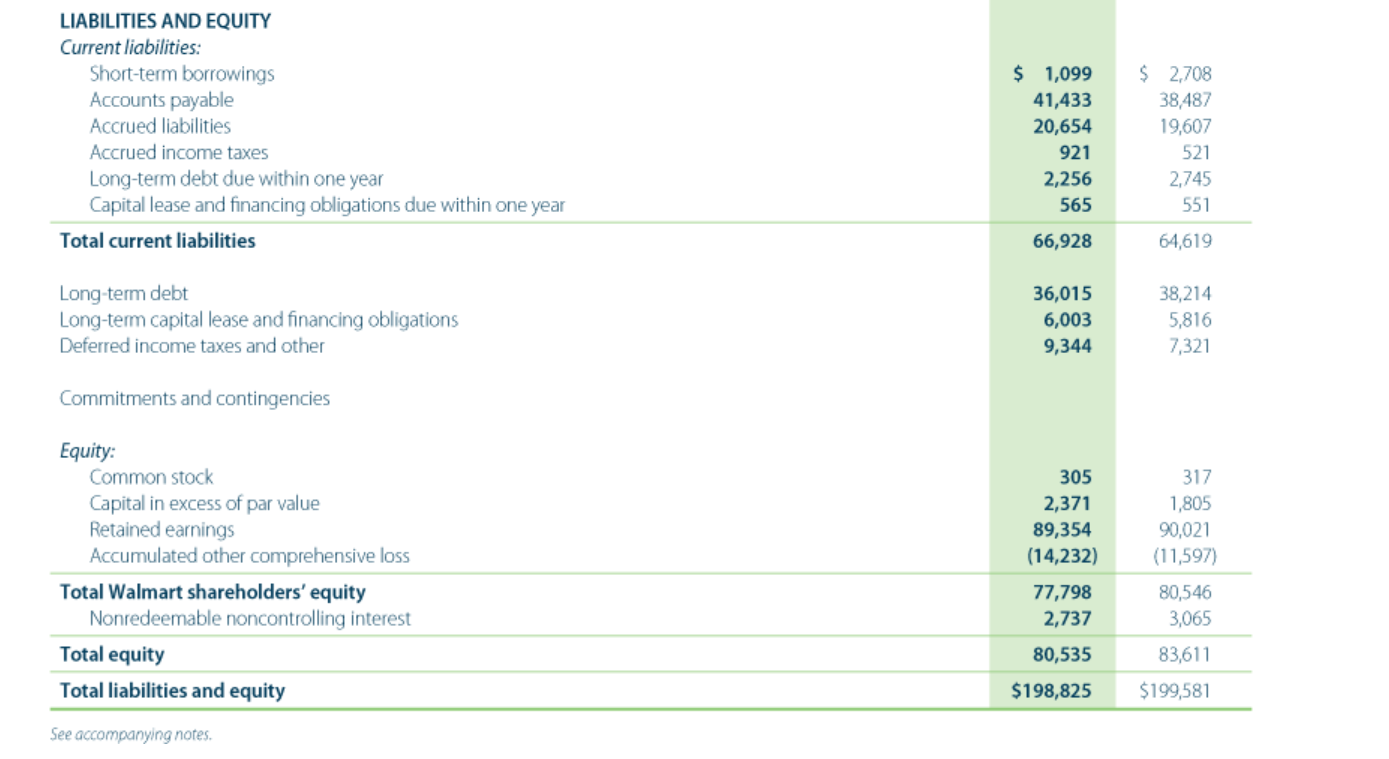
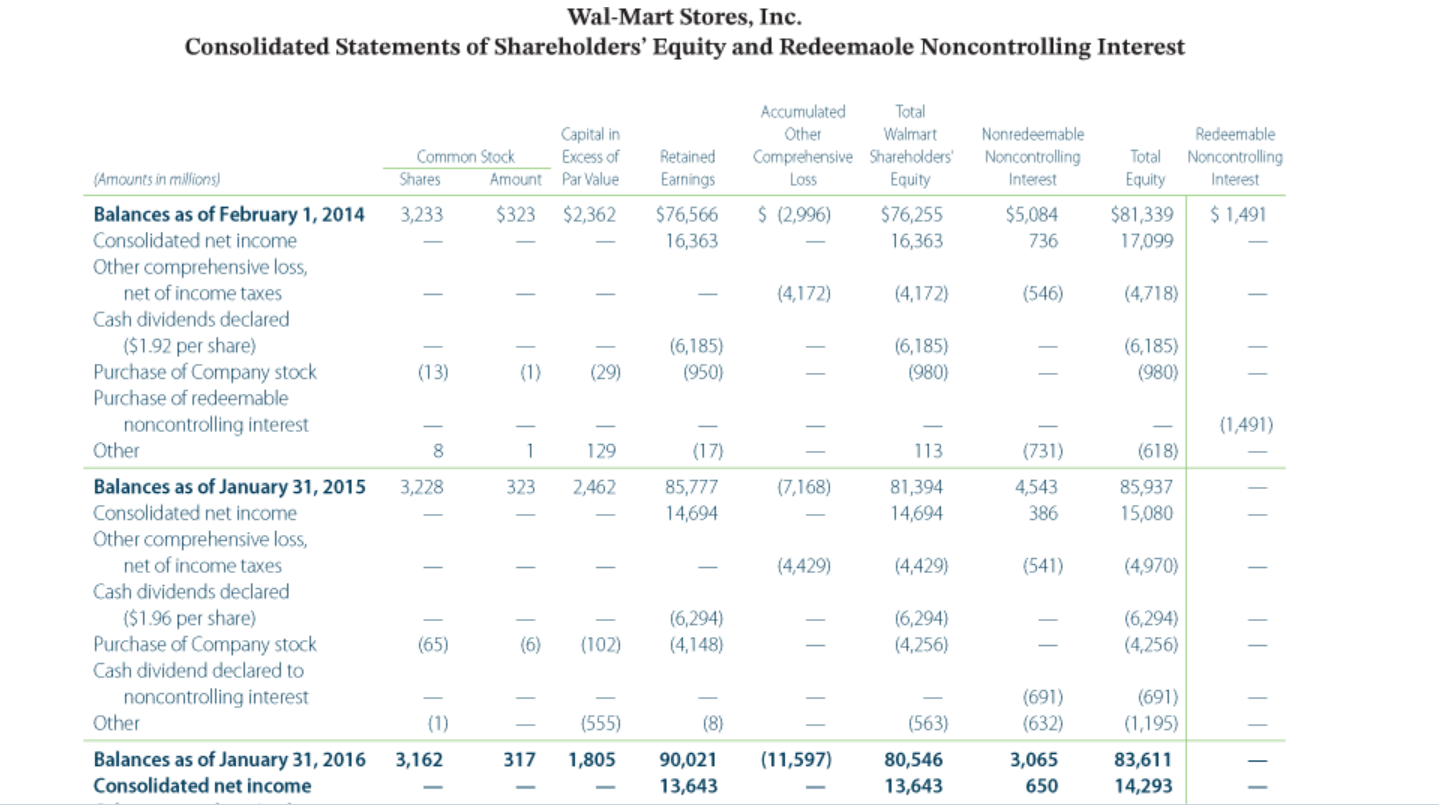
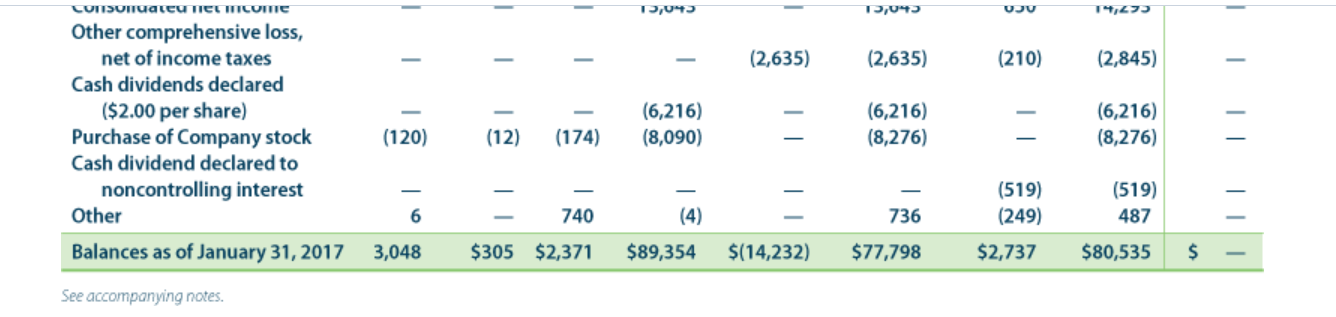
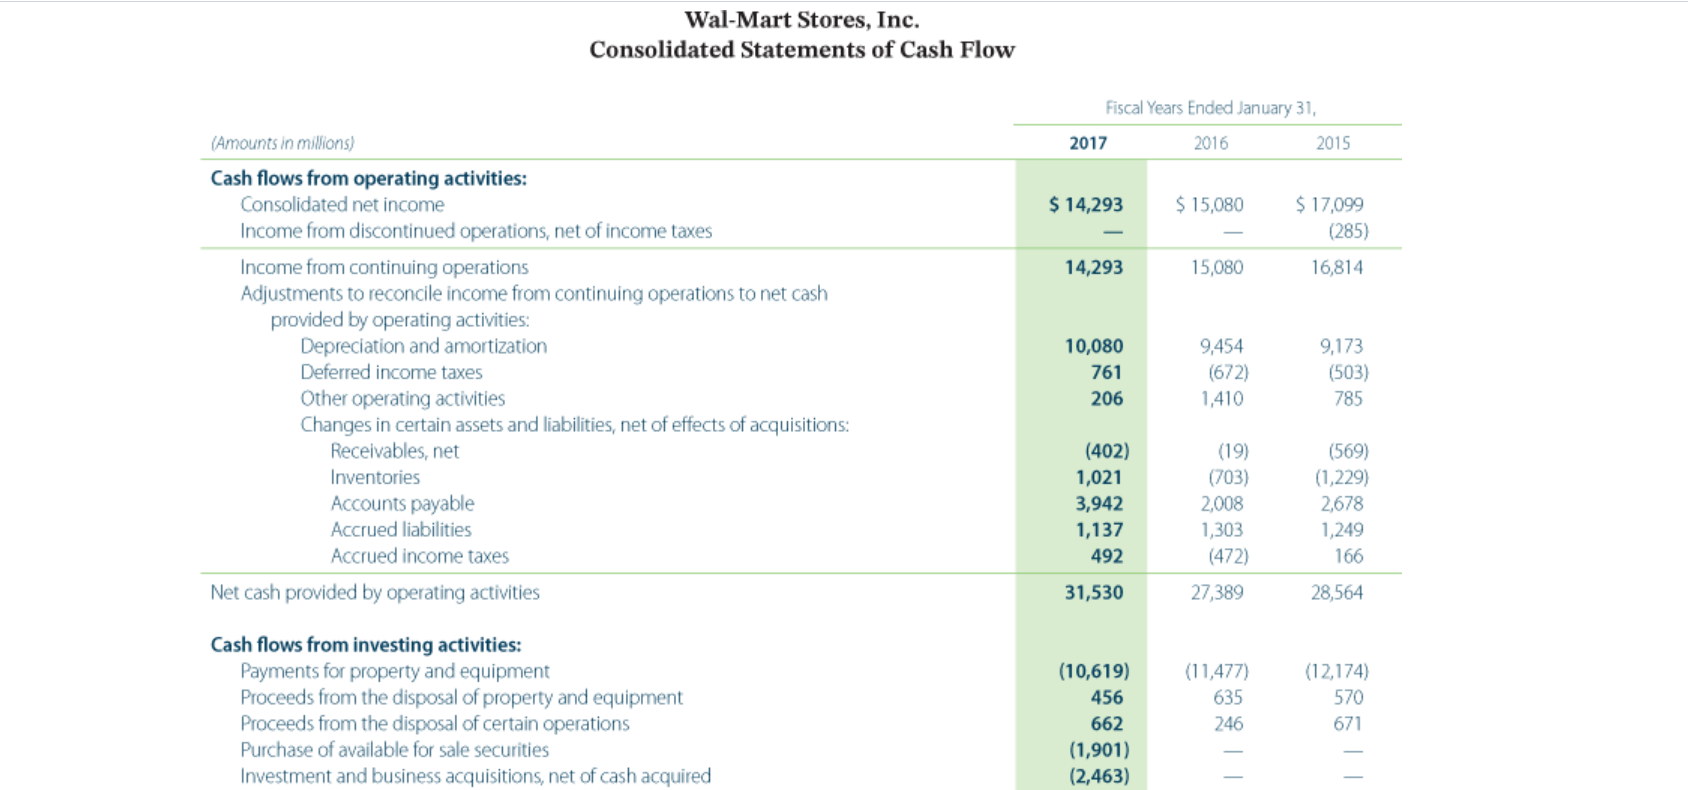
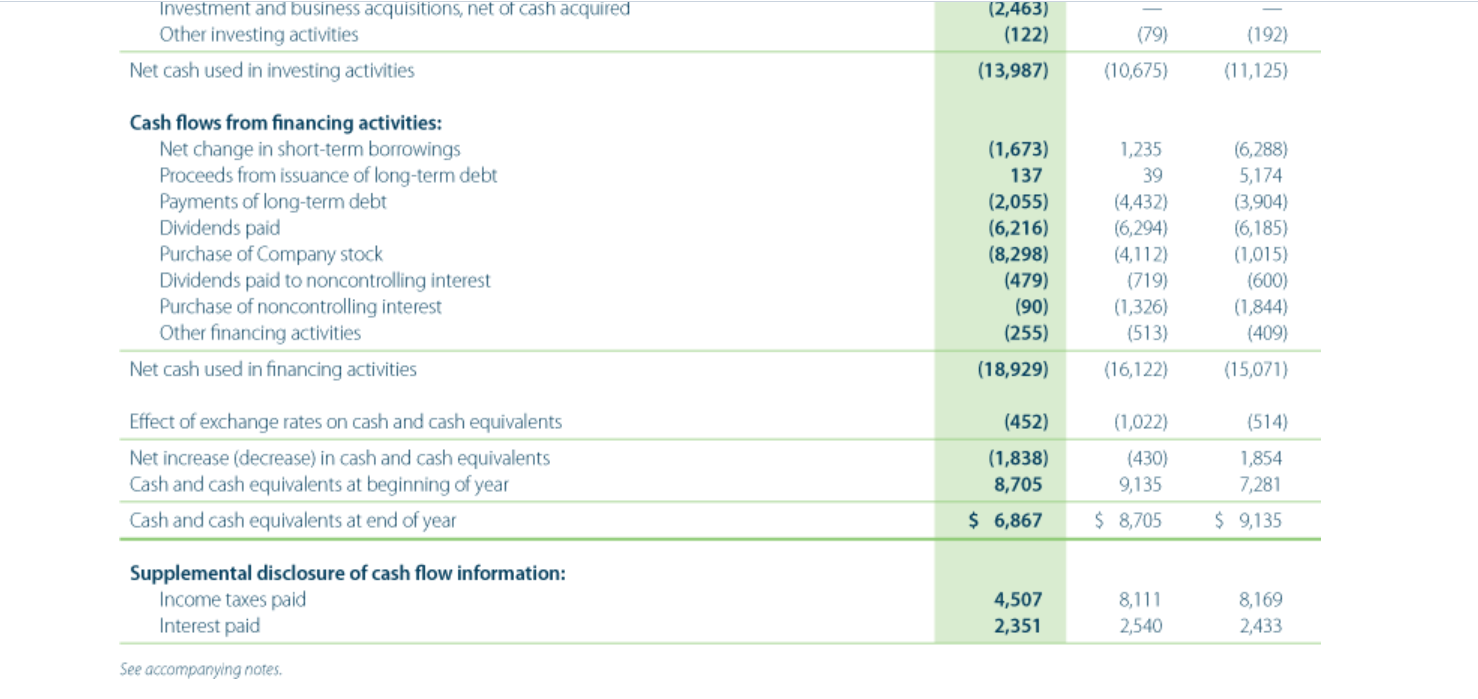
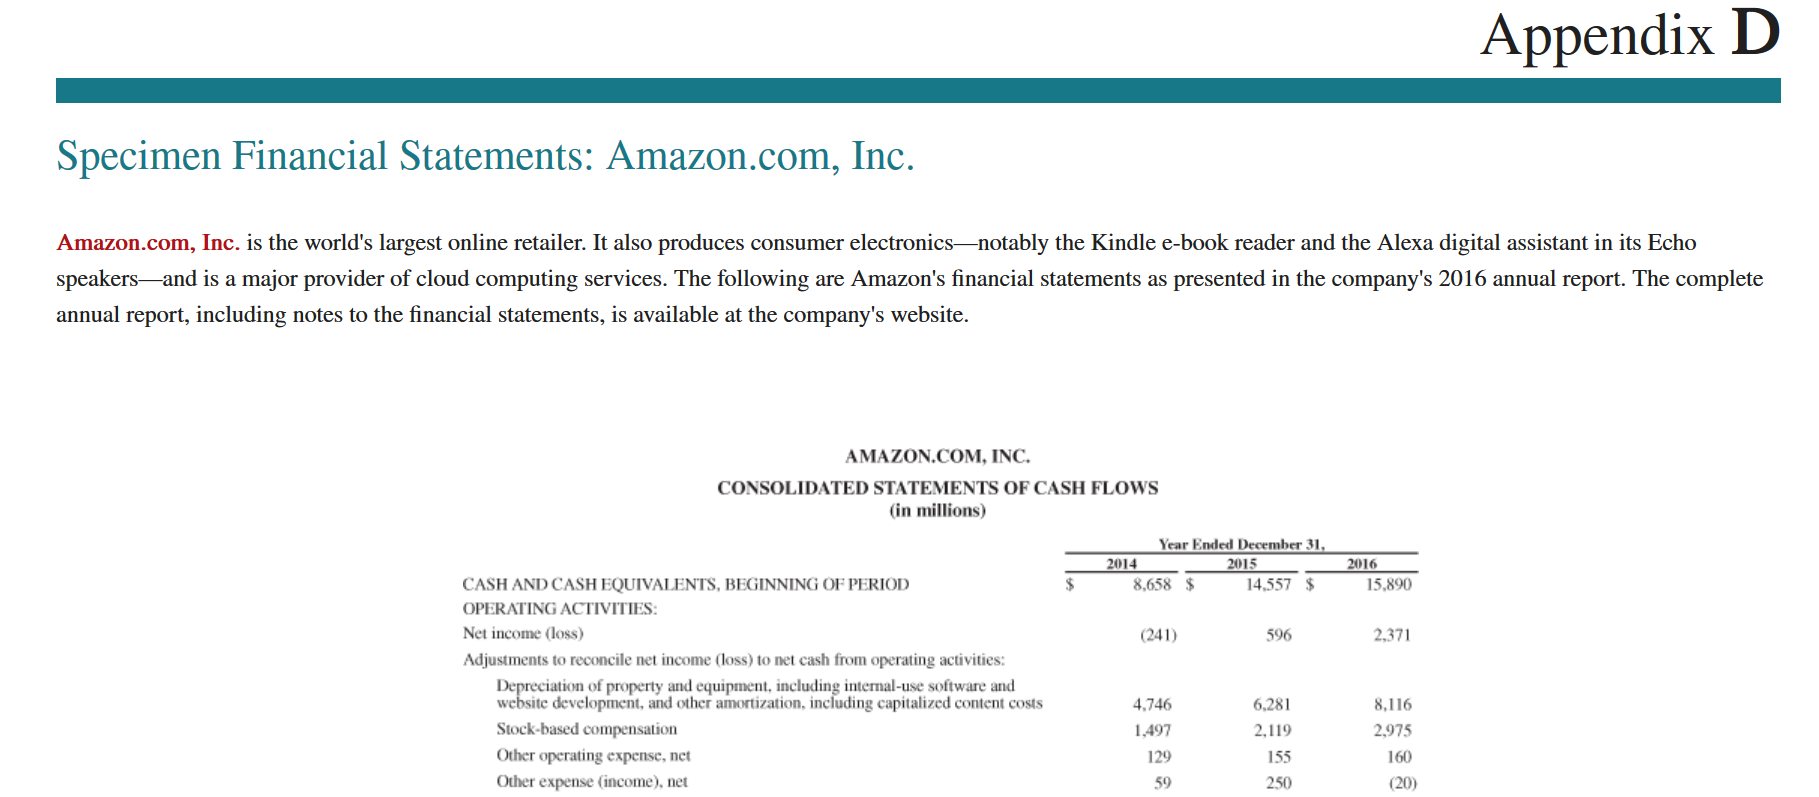
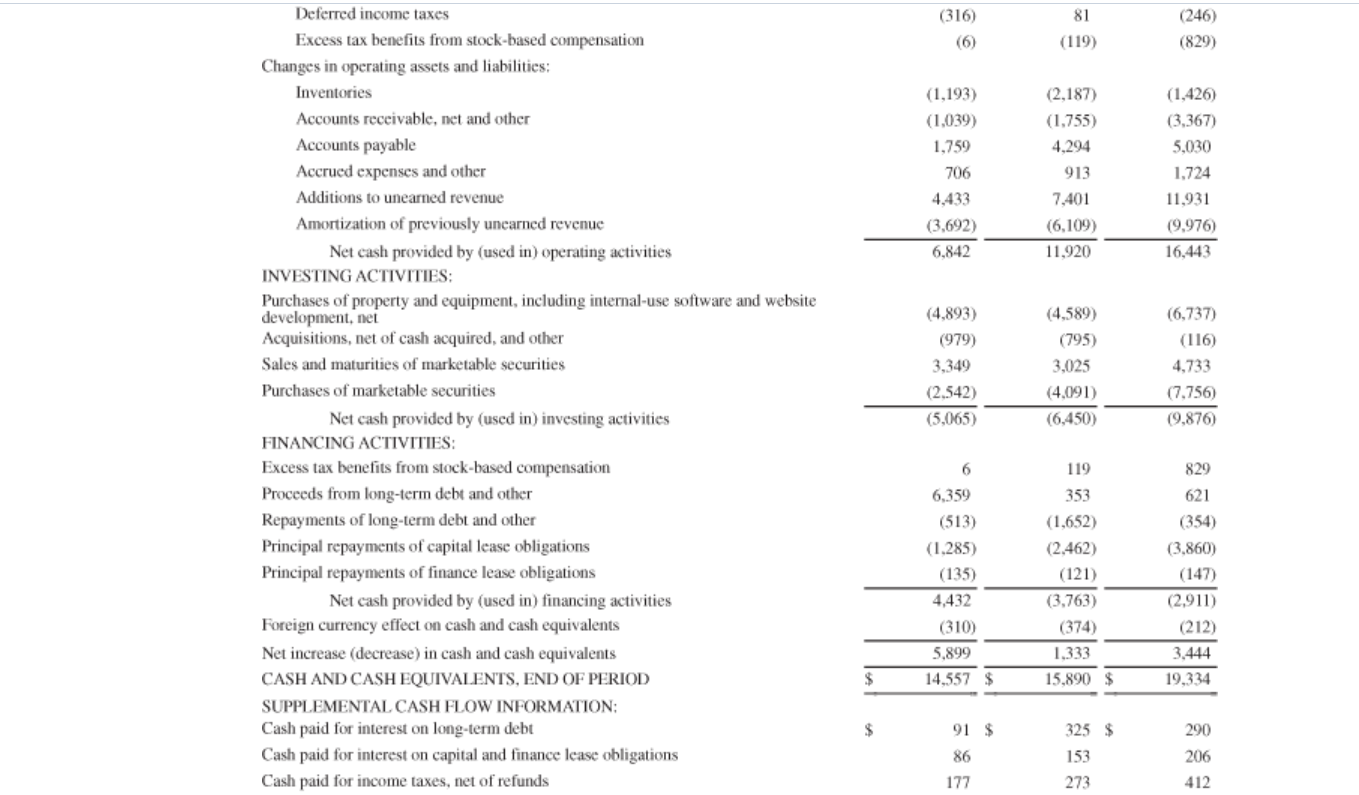
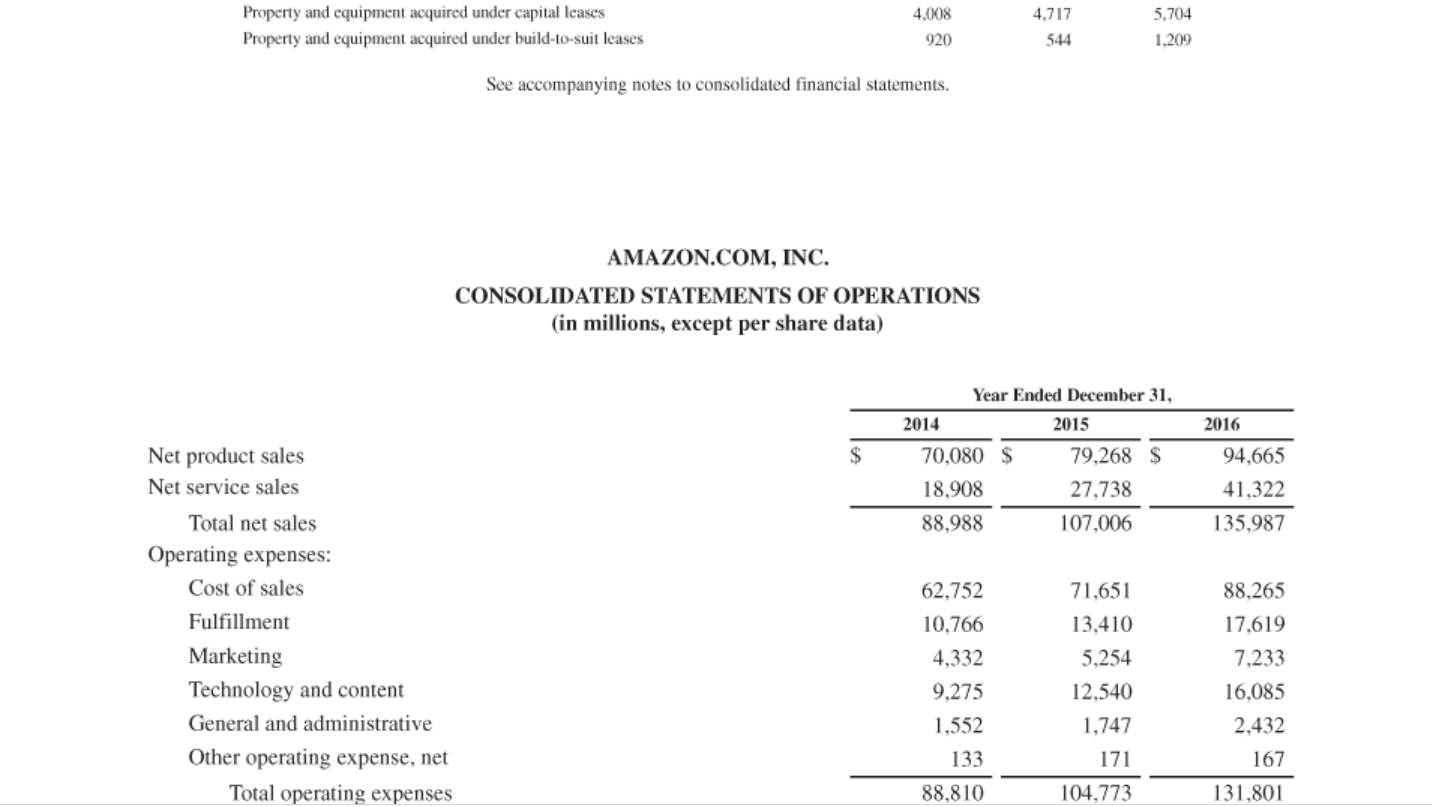
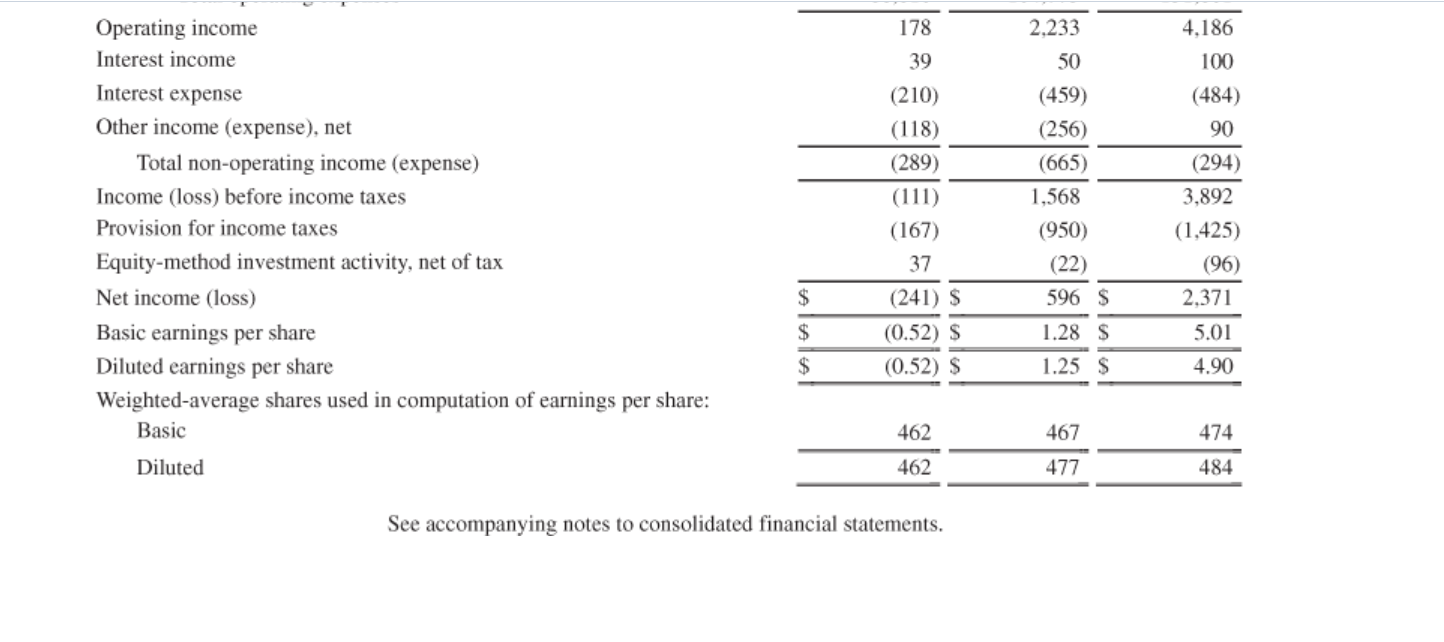
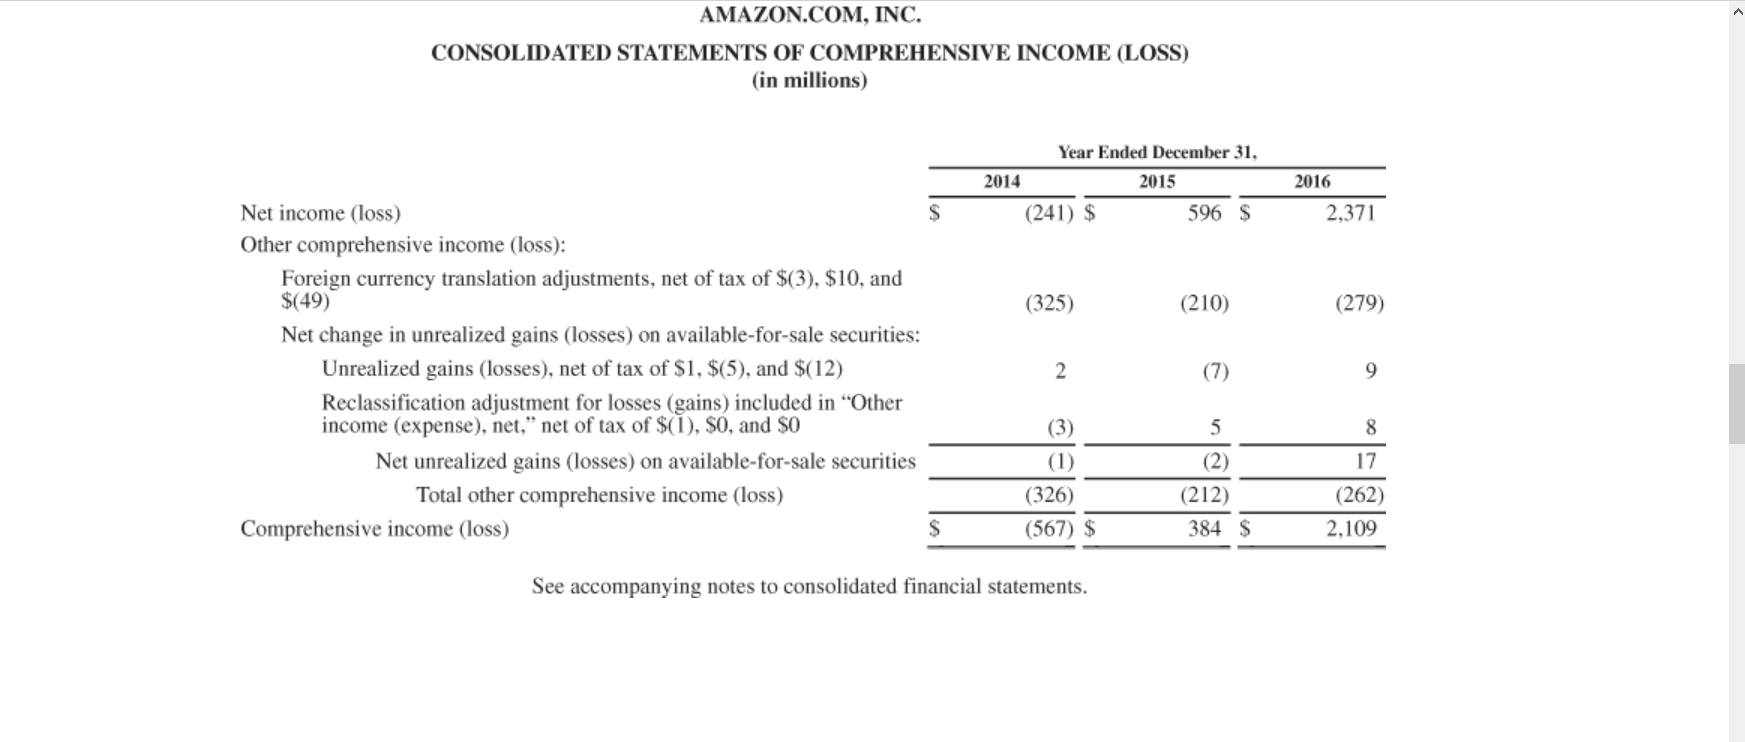
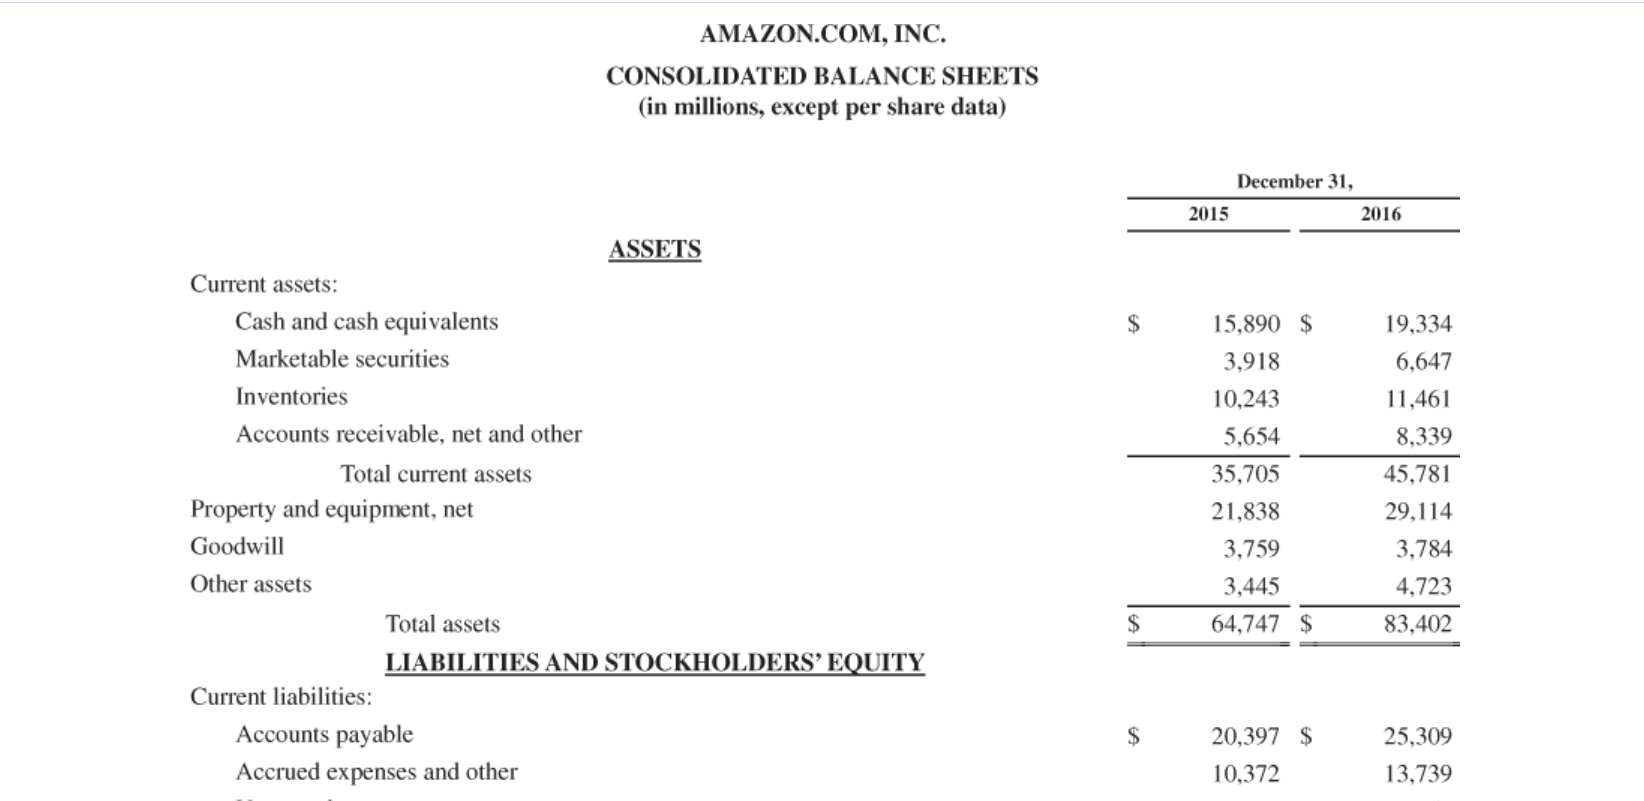
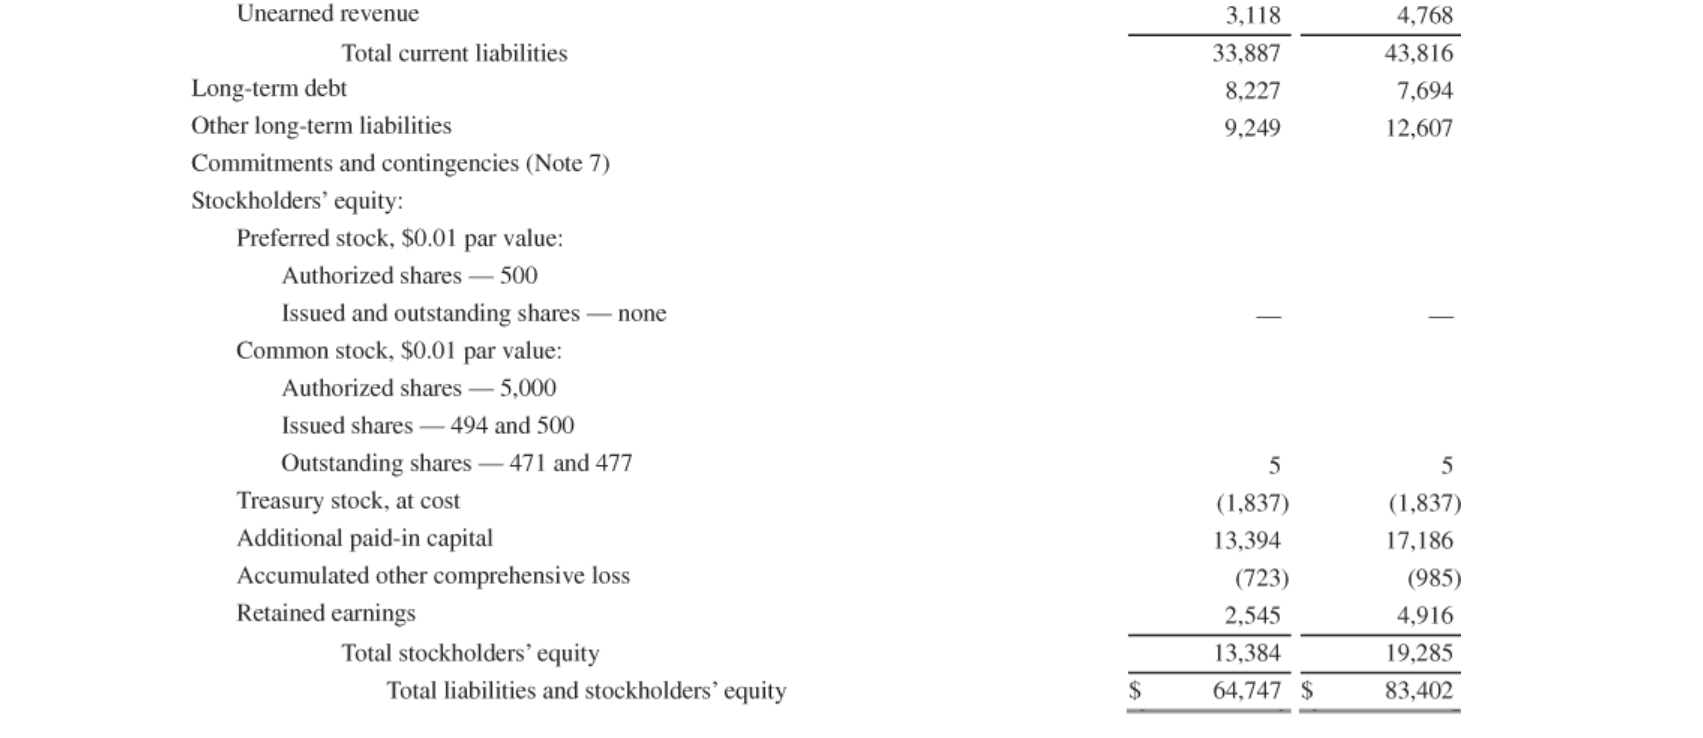
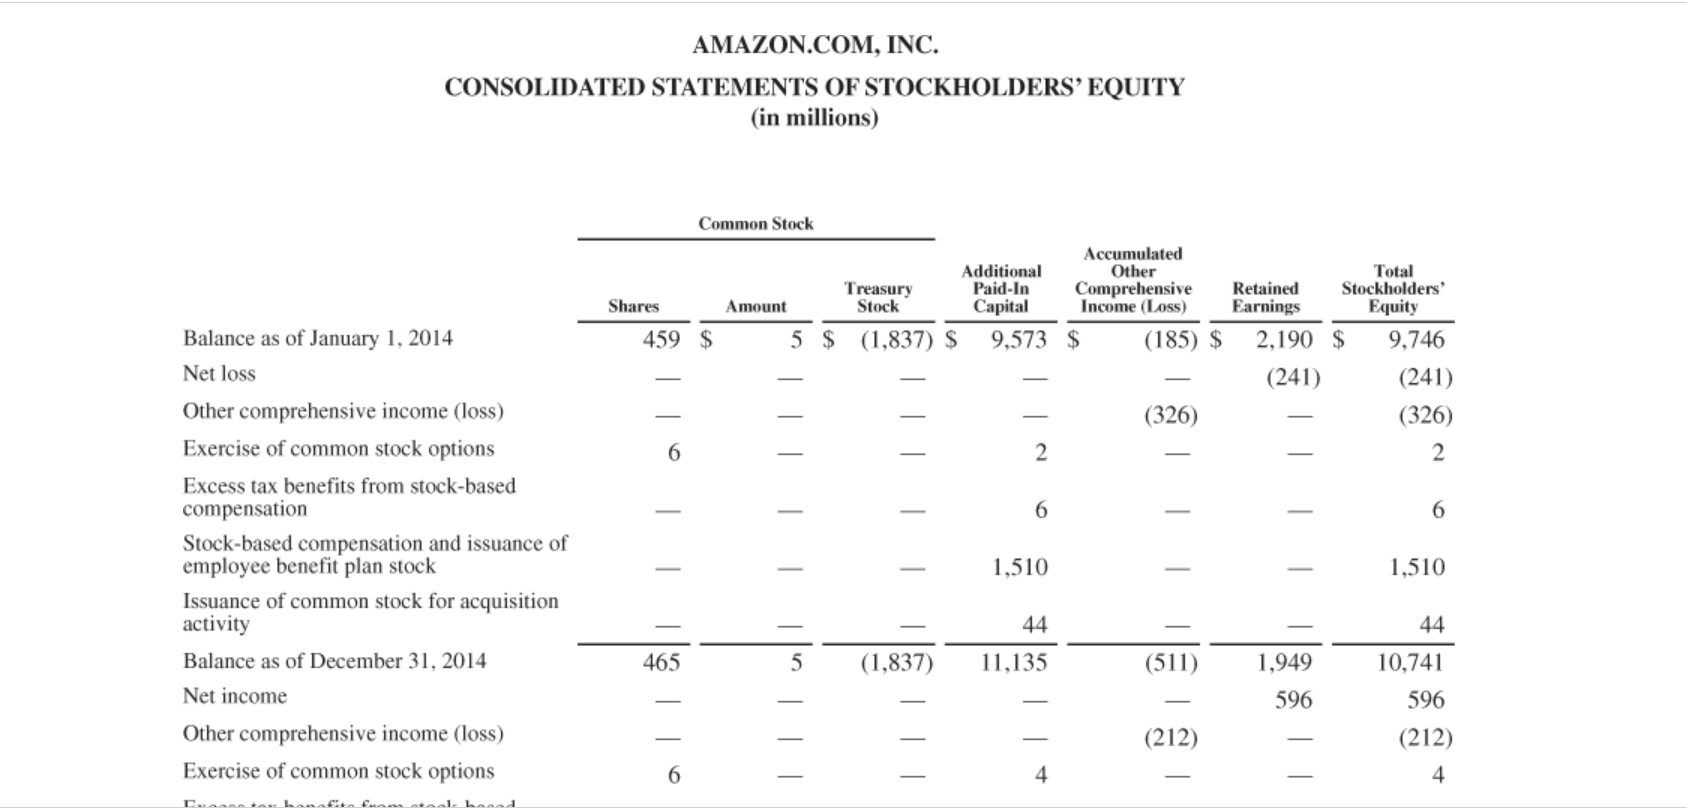
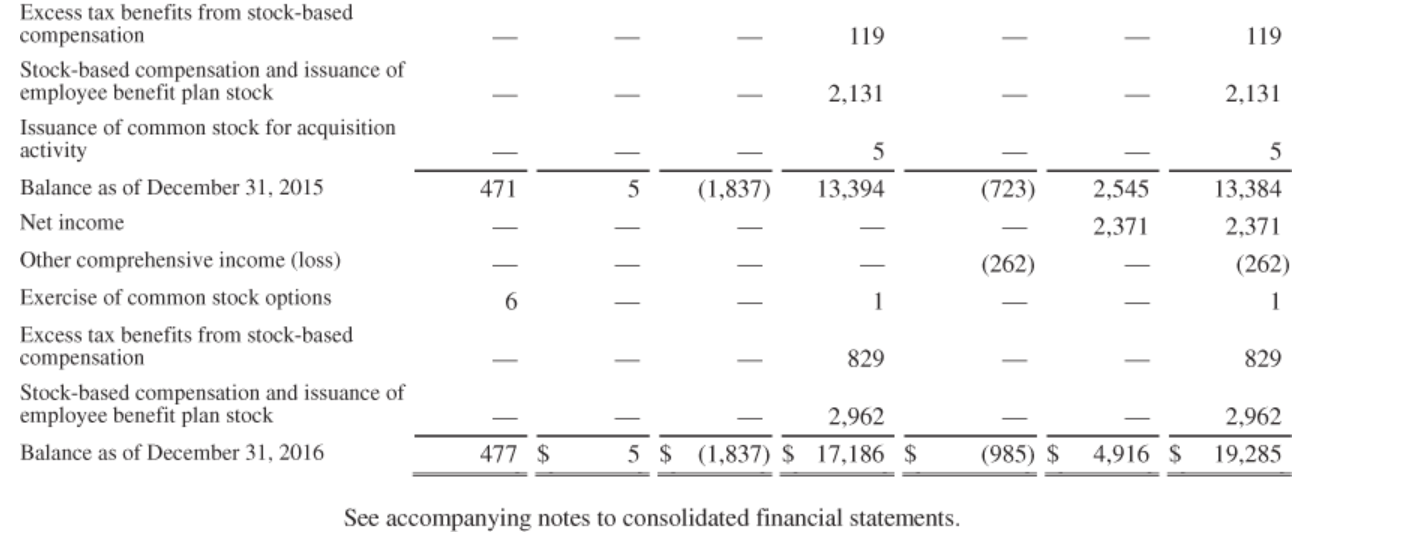
Appendix D Specimen Financial Statements: Amazon.com, Inc. Amazon.com, Inc. is the world's largest online retailer. It also produces consumer electronics-notably the Kindle e-book reader and the Alexa digital assistant in its Echo speakers-and is a major provider of cloud computing services. The following are Amazon's financial statements as presented in the company's 2016 annual report. The complete annual report, including notes to the financial statements, is available at the company's website. AMAZON.COM, INC. CONSOLIDATED STATEMENTS OF CASH FLOWS (in millions) Year Ended December 31, 2015 2016 2014 8,658 $ 2$ 14,557 $ CASH AND CASH EQUIVALENTS, BEGINNING OF PERIOD 15,890 OPERATING ACTIVITIES: Net income (loss) 2,371 (241) 596 Adjustments to reconcile net income (loss) to net cash from operating activities: Depreciation of property and equipment, including internal-use software and website development, and other amortization, including capitalized content costs 4,746 6,281 8,116 Stock-based compensation 1,497 2,119 2,975 Other operating expense, net 160 129 155 Other expense (income), net 59 250 (20) Deferred income taxes (316) 81 (246) Excess tax benefits from stock-based compensation (829) (6) (119) Changes in operating assets and liabilities: Inventories (1,193) (2,187) (1,426) Accounts receivable, net and other (1,039) (1,755) (3,367) Accounts payable 1,759 4,294 5,030 Accrued expenses and other 706 913 1,724 Additions to unearned revenue 4,433 7,401 11,931 Amortization of previously uncarned revenue (3,692) (6,109) (9,976) 16,443 Net cash provided by (used in) operating activities 6.842 11,920 INVESTING ACTIVITIES: Purchases of property and equipment, including internal-use software and website development, nei Acquisitions, net of cash acquired, and other (4,893) (6,737) (4,589) (979) (795) (116) Sales and maturities of marketable securities 3,349 3,025 4,733 Purchases of marketable securities (2,542) (4,091) (7,756) (5,065) Net cash provided by (uscd in) investing activities (6,450) (9,876) FINANCING ACTIVITIES: Excess tax benefits from stock-based compensation 119 829 Proceeds from long-term debt and other 6,359 353 621 Repayments of long-term debt and other (513) (1,652) (354) Principal repayments of capital lease obligations (2,462) (1,285) (3,860) Principal repayments of finance lease obligations (135) (121) (147) Net cash provided by (used in) financing activities 4,432 (3,763) (2,911) Foreign currency effect on cash and cash equivalents (310) (374) (212) Net increase (decrease) in cash and cash equivalents 5,899 1,333 3,444 CASH AND CASH EQUIVALENTS, END OF PERIOD 2$ 15,890 $ 19,334 14,557 $ SUPPLEMENTAL CASH FLOW INFORMATION: Cash paid for interest on long-term debt 325 $ 290 91 $ Cash paid for interest on capital and finance lease obligations 86 153 206 Cash paid for income taxes, net of refunds 177 273 412 Property and equipment acquired under capital leases 4,717 5,704 4,008 Property and equipment acquired under build-to-suit leases 920 544 1,209 See accompanying notes to consolidated financial statements. AMAZON.COM, INC. CONSOLIDATED STATEMENTS OF OPERATIONS (in millions, except per share data) Year Ended December 31, 2014 2015 2016 2$ 79,268 $ Net product sales 70,080 $ 94,665 Net service sales 18,908 27,738 41,322 88,988 Total net sales 107,006 135,987 Operating expenses: Cost of sales 62,752 71,651 88,265 Fulfillment 10,766 17,619 13,410 Marketing 5,254 4,332 7,233 Technology and content 9,275 12,540 16,085 General and administrative 1,747 1,552 2,432 Other operating expense, net 133 171 167 Total operating expenses 131,801 88,810 104,773 Operating income 178 2,233 4,186 Interest income 39 100 Interest expense (210) (459) (484) Other income (expense), net (118) (256) 90 (294) Total non-operating income (expense) (289) (665) Income (loss) before income taxes (111) 1,568 3,892 Provision for income taxes (167) (950) (1,425) Equity-method investment activity, net of tax 37 (22) (96) Net income (loss) 2$ 596 $ (241) $ 2,371 2$ (0.52) $ 5.01 Basic earnings per share 1.28 $ 4.90 Diluted earnings per share (0.52) $ 1.25 $ Weighted-average shares used in computation of earnings per share: Basic 462 467 474 Diluted 462 477 484 See accompanying notes to consolidated financial statements. AMAZON.COM, INC. CONSOLIDATED STATEMENTS OF COMPREHENSIVE INCOME (LOSS) (in millions) Year Ended December 31, 2015 2016 2014 Net income (loss) (241) $ 2,371 596 $ Other comprehensive income (loss): Foreign currency translation adjustments, net of tax of $(3), $10, and $(49) (210) (279) (325) Net change in unrealized gains (losses) on available-for-sale securities: Unrealized gains (losses), net of tax of $1, $(5), and $(12) (7) 9. Reclassification adjustment for losses (gains) included in "Other income (expense), net," net of tax of $(1), $0, and $0 (3) 5 Net unrealized gains (losses) on available-for-sale securities Total other comprehensive income (loss) (2) 17 (1) (212) (326) (262) Comprehensive income (loss) 2,109 (567) $ 384 $ See accompanying notes to consolidated financial statements. AMAZON.COM, INC. CONSOLIDATED BALANCE SHEETS (in millions, except per share data) December 31, 2015 2016 ASSETS Current assets: Cash and cash equivalents 15,890 $ 19,334 Marketable securities 3,918 6,647 Inventories 10,243 11,461 Accounts receivable, net and other 5,654 8,339 Total current assets 35,705 45,781 Property and equipment, net 21,838 29,114 Goodwill 3,759 3,784 Other assets 4,723 3,445 Total assets 64,747 $ 83,402 LIABILITIES AND STOCKHOLDERS EQUITY Current liabilities: Accounts payable 20,397 $ 25,309 Accrued expenses and other 10,372 13,739 Unearned revenue 3,118 4,768 Total current liabilities 33,887 43,816 Long-term debt 8,227 7,694 Other long-term liabilities 12,607 9,249 Commitments and contingencies (Note 7) Stockholders' equity: Preferred stock, $0.01 par value: Authorized shares 500 Issued and outstanding shares none Common stock, $0.01 par value: Authorized shares 5,000 Issued shares 494 and 500 Outstanding shares - 471 and 477 Treasury stock, at cost Additional paid-in capital (1,837) (1,837) 13,394 17,186 Accumulated other comprehensive loss (723) (985) Retained earnings 2,545 4,916 Total stockholders equity 13,384 19,285 Total liabilities and stockholders equity 64,747 $ 83,402 AMAZON.COM, INC. CONSOLIDATED STATEMENTS OF STOCKHOLDERS EQUITY (in millions) Common Stock Accumulated Other Comprehensive Income (Loss) Total Stockholders' Equity Additional Paid-In Capital Treasury Stock Retained Shares Amount Earnings 5 $ (1,837) $ Balance as of January 1, 2014 459 $ 9,573 $ 2,190 $ (185) $ 9,746 Net loss (241) (241) Other comprehensive income (loss) (326) (326) Exercise of common stock options 6. 2 Excess tax benefits from stock-based compensation Stock-based compensation and issuance of employee benefit plan stock 1,510 1,510 Issuance of common stock for acquisition activity 44 44 Balance as of December 31, 2014 11,135 465 (1,837) (511) 1,949 10,741 Net income 596 596 Other comprehensive income (loss) (212) (212) Exercise of common stock options 6. 4 4 | Excess tax benefits from stock-based compensation 119 119 Stock-based compensation and issuance of employee benefit plan stock 2,131 2,131 Issuance of common stock for acquisition activity 5 5 Balance as of December 31, 2015 (1,837) 13,394 (723) 2,545 13,384 471 Net income 2,371 2,371 Other comprehensive income (loss) (262) (262) Exercise of common stock options 6. 1 Excess tax benefits from stock-based compensation 829 829 Stock-based compensation and issuance of employee benefit plan stock 2,962 2,962 5 $ (1,837) $ 17,186 $ 477 $ Balance as of December 31, 2016 (985) $ 4,91 19,285 See accompanying notes to consolidated financial statements. Appendix E Specimen Financial Statements: Wal-Mart Stores, Inc. The following are Wal-Mart Stores, Inc.'s financial statements as presented in the -company's annual report for the year ended January 31, 2017. The complete annual -report, including notes to the financial statements, is available at the company's website. Wal-Mart Stores, Inc. Consolidated Statement of Income Fiscal Years Ended January 31, (Amounts in millions, except per share data) 2017 2016 2015 Revenues: $478,614 3,516 Net sales $481,317 4,556 $482,229 3,422 Membership and other income Total revenues Costs and expenses: Cost of sales Operating, selling, general and administrative expenses 485,873 482,130 485,651 365,086 93,418 360,984 97,041 361,256 101,853 Operating income Interest: Debt 22,764 24,105 27,147 2,044 2,027 2,161 Capital lease and financing obligations 323 521 300 (81) (100) Interest income (113) Interest, net 2,267 2,467 2,348 Income from continuing operations before income taxes Provision for income taxes 20,497 24,799 7,985 21,638 6,558 6,204 Income from continuing operations Income from discontinued operations, net of income taxes 14,293 15,080 16,814 285 Consolidated net income 14,293 (650) 15,080 (386) 17,099 (736) Consolidated net income attributable to noncontrolling interest $ 13,643 $ 14,694 $ 16,363 Consolidated net income attributable to Walmart Basic net income per common share: Basic income per common share from continuing operations attributable to Walmart Basic income per common share from discontinued operations attributable to Walmart 4.58 %24 4.40 5.01 0.06 - Basic net income per common share attributable to Walmart 4.58 5.07 4.40 Diluted net income per common share: Diluted income per common share from continuing operations attributable to Walmart Diluted income per common share from discontinued operations attributable to Walmart 24 0.06 2$ 4.57 4.38 4.99 Diluted net income per common share attributable to Walmart 2$ 4.57 5.05 4.38 Weighted-average common shares outstanding: Basic Diluted 3,207 3,217 3,230 3,243 3,101 3,112 Dividends declared per common share 2.00 1.96 1.92 See accompanying notes. %24 %24 Wal-Mart Stores, Inc. Consolidated Statement of Comprehensive Income Fiscal Years Ended January 31, (Amounts in millions) 2016 2015 2017 Consolidated net income $15,080 (386) $17,099 (736) $14,293 (650) Less consolidated net income attributable to nonredeemable noncontrolling interest Consolidated net income attributable to Walmart 14,694 16,363 13,643 Other comprehensive income (loss), net of income taxes Currency translation and other Net investment hedges Cash flow hedges Minimum pension liability (5,220) 366 (4,558) (2,882) 413 379 (202) 21 (470) (69) (397) 86 Other comprehensive income (loss), net of income taxes Less other comprehensive income (loss) attributable to nonredeemable noncontrolling interest (4,970) 541 (4,718) 546 (2,845) 210 (2,635) Other comprehensive income (loss) attributable to Walmart (4,429) (4,172) Comprehensive income, net of income taxes Less comprehensive income (loss) attributable to nonredeemable noncontrolling interest 11,448 (440) 10,110 155 12,381 (190) Comprehensive income attributable to Walmart $10,265 $12,191 $11,008 See accompanying notes. Wal-Mart Stores, Inc. Consolidated Balance Sheets As of January 31, (Amounts in millons) 2016 2017 ASSETS Current assets: Cash and cash equivalents Receivables, net $ 6,867 $ 8,705 5,835 5,624 44,469 Inventories 43,046 Prepaid expenses and other 1,941 1,441 Total current assets 57,689 60,239 Property and equipment: Property and equipment Less accumulated depreciation 176,958 (66,787) 179,492 (71,782) Property and equipment, net Property under capital lease and financing obligations: Property under capital lease and financing obligations Less accumulated amortization 110,171 107,710 11,637 11,096 (5,169) (4,751) Property under capital lease and financing obligations, net 6,468 6,345 Goodwill 17,037 9,921 16,695 Other assets and deferred charges 6,131 Total assets $199,581 $198,825 LIABILITIES AND EQUITY Current liabilities: $ 1,099 $ 2,708 38,487 Short-term borrowings Accounts payable Accrued liabilities 41,433 19,607 20,654 Accrued income taxes 521 921 Long-term debt due within one year Capital lease and financing obligations due within one year 2,256 2,745 551 565 Total current liabilities 66,928 64,619 Long-term debt Long-term capital lease and financing obligations 38,214 5,816 36,015 6,003 Deferred income taxes and other 7,321 9,344 Commitments and contingencies Equity: Common stock 305 317 Capital in excess of par value Retained earnings Accumulated other comprehensive loss 2,371 1,805 89,354 90,021 (14,232) (11,597) Total Walmart shareholders' equity Nonredeemable noncontrolling interest 77,798 2,737 80,546 3,065 Total equity 83,611 80,535 Total liabilities and equity $199,581 $198,825 See accompanying notes. Wal-Mart Stores, Inc. Consolidated Statements of Shareholders' Equity and Redeemaole Noncontrolling Interest Accumulated Total Walmart Comprehensive Shareholders' Equity Redeemable Noncontrolling Capital in Excess of Other Nonredeemable Common Stock Retained Noncontrolling Total (Amounts in millions) Shares Amount Par Value Earnings Loss Equity Interest Interest $ (2,996) $ 1,491 $2,362 Balances as of February 1, 2014 $323 $5,084 $81,339 17,099 3,233 $76,566 16,363 $76,255 Consolidated net income 16,363 736 Other comprehensive loss, net of income taxes (4,172) (546) (4,172) (4,718) Cash dividends declared ($1.92 per share) Purchase of Company stock Purchase of redeemable (6,185) (950) (6,185) (980) (6,185) (13) (1) (29) (980) noncontrolling interest Other (1,491) 1 129 (17) (731) (618) 113 Balances as of January 31, 2015 Consolidated net income 85,777 14,694 3,228 323 2,462 (7,168) 81,394 4,543 85,937 14,694 386 15,080 Other comprehensive loss, net of income taxes (4,429) (4,429) (541) (4,970) Cash dividends declared ($1.96 per share) Purchase of Company stock Cash dividend declared to (6,294) (6,294) (6,294) (65) (6) (4,256) (102) (4,148) (4,256) noncontrolling interest Other (691) (632) (691) (563) (1,195) (1) (555) (8) Balances as of January 31, 2016 Consolidated net income (11,597) 3,162 317 1,805 90,021 80,546 3,065 83,611 13,643 13,643 14,293 650 || |||| COISUnuateu TIET ICUME T,043 T4,273 Other comprehensive loss, net of income taxes (2,635) (2,635) (210) (2,845) Cash dividends declared (6,216) (8,276) ($2.00 per share) Purchase of Company stock Cash dividend declared to (6,216) (6,216) (8,276) (12) (8,090) (120) (174) noncontrolling interest Other (519) (249) (519) 740 (4) 736 487 $305 $2,371 Balances as of January 31, 2017 3,048 $89,354 $(14,232) $77,798 $2,737 $80,535 See accompanying notes. Wal-Mart Stores, Inc. Consolidated Statements of Cash Flow Fiscal Years Ended January 31, (Amounts in millions) 2017 2016 2015 Cash flows from operating activities: $ 14,293 $ 15,080 $ 17,099 (285) Consolidated net income Income from discontinued operations, net of income taxes Income from continuing operations Adjustments to reconcile income from continuing operations to net cash provided by operating activities: Depreciation and amortization 15,080 16,814 14,293 10,080 9,173 9,454 Deferred income taxes (672) 1,410 761 (503) Other operating activities Changes in certain assets and liabilities, net of effects of acquisitions: Receivables, net 206 785 (402) (19) (703) (569) (1,229) Inventories 1,021 Accounts payable 3,942 2,008 2,678 Accrued liabilities 1,137 1,303 1,249 Accrued income taxes (472) 166 492 Net cash provided by operating activities 27,389 31,530 28,564 Cash flows from investing activities: Payments for property and equipment Proceeds from the disposal of property and equipment Proceeds from the disposal of certain operations Purchase of available for sale securities (10,619) (11,477) (12,174) 635 570 456 662 671 246 (1,901) Investment and business acquisitions, net of cash acquired (2,463) Investment and business acquisitions, net of cash acquired Other investing activities (2,463) (122) (79) (192) Net cash used in investing activities (13,987) (10,675) (11,125) Cash flows from financing activities: Net change in short-term borrowings Proceeds from issuance of long-term debt Payments of long-term debt Dividends paid Purchase of Company stock Dividends paid to noncontrolling interest Purchase of noncontrolling interest Other financing activities 1,235 (6,288) 5,174 (3,904) (6,185) (1,673) 39 137 (2,055) (6,216) (8,298) (4,432) (6,294) (4,112) (719) (1,326) (513) (1,015) (479) (90) (255) (600) (1,844) (409) Net cash used in financing activities (18,929) (16,122) (15,071) Effect of exchange rates on cash and cash equivalents (1,022) (452) (514) Net increase (decrease) in cash and cash equivalents Cash and cash equivalents at beginning of year 1,854 7,281 (1,838) (430) 9,135 8,705 $ 8,705 Cash and cash equivalents at end of year $ 6,867 $ 9,135 Supplemental disclosure of cash flow information: Income taxes paid Interest paid 4,507 8,111 8,169 2,433 2,351 2,540 See accompanying notes. Amazon.com, Inc.'s financial statements are presented in Appendix D. Click here to view Appendix D. Financial statements of Wal-Mart Stores, Inc. are presented in Appendix E. Click here to view Appendix E. (a) Based on the information contained in these financial statements, compute free cash flow for Amazon at December 31, 2016 and Wal-Mart for January 31, 2017. (Show a negative free cash flow with either a - sign e.g. -15,000 or in parenthesis e.g. (15,000). Enter amounts in millions.) Wal-Mart Stores, Inc. Amazon.com, Inc. Free cash flow Appendix D Specimen Financial Statements: Amazon.com, Inc. Amazon.com, Inc. is the world's largest online retailer. It also produces consumer electronics-notably the Kindle e-book reader and the Alexa digital assistant in its Echo speakers-and is a major provider of cloud computing services. The following are Amazon's financial statements as presented in the company's 2016 annual report. The complete annual report, including notes to the financial statements, is available at the company's website. AMAZON.COM, INC. CONSOLIDATED STATEMENTS OF CASH FLOWS (in millions) Year Ended December 31, 2015 2016 2014 8,658 $ 2$ 14,557 $ CASH AND CASH EQUIVALENTS, BEGINNING OF PERIOD 15,890 OPERATING ACTIVITIES: Net income (loss) 2,371 (241) 596 Adjustments to reconcile net income (loss) to net cash from operating activities: Depreciation of property and equipment, including internal-use software and website development, and other amortization, including capitalized content costs 4,746 6,281 8,116 Stock-based compensation 1,497 2,119 2,975 Other operating expense, net 160 129 155 Other expense (income), net 59 250 (20) Deferred income taxes (316) 81 (246) Excess tax benefits from stock-based compensation (829) (6) (119) Changes in operating assets and liabilities: Inventories (1,193) (2,187) (1,426) Accounts receivable, net and other (1,039) (1,755) (3,367) Accounts payable 1,759 4,294 5,030 Accrued expenses and other 706 913 1,724 Additions to unearned revenue 4,433 7,401 11,931 Amortization of previously uncarned revenue (3,692) (6,109) (9,976) 16,443 Net cash provided by (used in) operating activities 6.842 11,920 INVESTING ACTIVITIES: Purchases of property and equipment, including internal-use software and website development, nei Acquisitions, net of cash acquired, and other (4,893) (6,737) (4,589) (979) (795) (116) Sales and maturities of marketable securities 3,349 3,025 4,733 Purchases of marketable securities (2,542) (4,091) (7,756) (5,065) Net cash provided by (uscd in) investing activities (6,450) (9,876) FINANCING ACTIVITIES: Excess tax benefits from stock-based compensation 119 829 Proceeds from long-term debt and other 6,359 353 621 Repayments of long-term debt and other (513) (1,652) (354) Principal repayments of capital lease obligations (2,462) (1,285) (3,860) Principal repayments of finance lease obligations (135) (121) (147) Net cash provided by (used in) financing activities 4,432 (3,763) (2,911) Foreign currency effect on cash and cash equivalents (310) (374) (212) Net increase (decrease) in cash and cash equivalents 5,899 1,333 3,444 CASH AND CASH EQUIVALENTS, END OF PERIOD 2$ 15,890 $ 19,334 14,557 $ SUPPLEMENTAL CASH FLOW INFORMATION: Cash paid for interest on long-term debt 325 $ 290 91 $ Cash paid for interest on capital and finance lease obligations 86 153 206 Cash paid for income taxes, net of refunds 177 273 412 Property and equipment acquired under capital leases 4,717 5,704 4,008 Property and equipment acquired under build-to-suit leases 920 544 1,209 See accompanying notes to consolidated financial statements. AMAZON.COM, INC. CONSOLIDATED STATEMENTS OF OPERATIONS (in millions, except per share data) Year Ended December 31, 2014 2015 2016 2$ 79,268 $ Net product sales 70,080 $ 94,665 Net service sales 18,908 27,738 41,322 88,988 Total net sales 107,006 135,987 Operating expenses: Cost of sales 62,752 71,651 88,265 Fulfillment 10,766 17,619 13,410 Marketing 5,254 4,332 7,233 Technology and content 9,275 12,540 16,085 General and administrative 1,747 1,552 2,432 Other operating expense, net 133 171 167 Total operating expenses 131,801 88,810 104,773 Operating income 178 2,233 4,186 Interest income 39 100 Interest expense (210) (459) (484) Other income (expense), net (118) (256) 90 (294) Total non-operating income (expense) (289) (665) Income (loss) before income taxes (111) 1,568 3,892 Provision for income taxes (167) (950) (1,425) Equity-method investment activity, net of tax 37 (22) (96) Net income (loss) 2$ 596 $ (241) $ 2,371 2$ (0.52) $ 5.01 Basic earnings per share 1.28 $ 4.90 Diluted earnings per share (0.52) $ 1.25 $ Weighted-average shares used in computation of earnings per share: Basic 462 467 474 Diluted 462 477 484 See accompanying notes to consolidated financial statements. AMAZON.COM, INC. CONSOLIDATED STATEMENTS OF COMPREHENSIVE INCOME (LOSS) (in millions) Year Ended December 31, 2015 2016 2014 Net income (loss) (241) $ 2,371 596 $ Other comprehensive income (loss): Foreign currency translation adjustments, net of tax of $(3), $10, and $(49) (210) (279) (325) Net change in unrealized gains (losses) on available-for-sale securities: Unrealized gains (losses), net of tax of $1, $(5), and $(12) (7) 9. Reclassification adjustment for losses (gains) included in "Other income (expense), net," net of tax of $(1), $0, and $0 (3) 5 Net unrealized gains (losses) on available-for-sale securities Total other comprehensive income (loss) (2) 17 (1) (212) (326) (262) Comprehensive income (loss) 2,109 (567) $ 384 $ See accompanying notes to consolidated financial statements. AMAZON.COM, INC. CONSOLIDATED BALANCE SHEETS (in millions, except per share data) December 31, 2015 2016 ASSETS Current assets: Cash and cash equivalents 15,890 $ 19,334 Marketable securities 3,918 6,647 Inventories 10,243 11,461 Accounts receivable, net and other 5,654 8,339 Total current assets 35,705 45,781 Property and equipment, net 21,838 29,114 Goodwill 3,759 3,784 Other assets 4,723 3,445 Total assets 64,747 $ 83,402 LIABILITIES AND STOCKHOLDERS EQUITY Current liabilities: Accounts payable 20,397 $ 25,309 Accrued expenses and other 10,372 13,739 Unearned revenue 3,118 4,768 Total current liabilities 33,887 43,816 Long-term debt 8,227 7,694 Other long-term liabilities 12,607 9,249 Commitments and contingencies (Note 7) Stockholders' equity: Preferred stock, $0.01 par value: Authorized shares 500 Issued and outstanding shares none Common stock, $0.01 par value: Authorized shares 5,000 Issued shares 494 and 500 Outstanding shares - 471 and 477 Treasury stock, at cost Additional paid-in capital (1,837) (1,837) 13,394 17,186 Accumulated other comprehensive loss (723) (985) Retained earnings 2,545 4,916 Total stockholders equity 13,384 19,285 Total liabilities and stockholders equity 64,747 $ 83,402 AMAZON.COM, INC. CONSOLIDATED STATEMENTS OF STOCKHOLDERS EQUITY (in millions) Common Stock Accumulated Other Comprehensive Income (Loss) Total Stockholders' Equity Additional Paid-In Capital Treasury Stock Retained Shares Amount Earnings 5 $ (1,837) $ Balance as of January 1, 2014 459 $ 9,573 $ 2,190 $ (185) $ 9,746 Net loss (241) (241) Other comprehensive income (loss) (326) (326) Exercise of common stock options 6. 2 Excess tax benefits from stock-based compensation Stock-based compensation and issuance of employee benefit plan stock 1,510 1,510 Issuance of common stock for acquisition activity 44 44 Balance as of December 31, 2014 11,135 465 (1,837) (511) 1,949 10,741 Net income 596 596 Other comprehensive income (loss) (212) (212) Exercise of common stock options 6. 4 4 | Excess tax benefits from stock-based compensation 119 119 Stock-based compensation and issuance of employee benefit plan stock 2,131 2,131 Issuance of common stock for acquisition activity 5 5 Balance as of December 31, 2015 (1,837) 13,394 (723) 2,545 13,384 471 Net income 2,371 2,371 Other comprehensive income (loss) (262) (262) Exercise of common stock options 6. 1 Excess tax benefits from stock-based compensation 829 829 Stock-based compensation and issuance of employee benefit plan stock 2,962 2,962 5 $ (1,837) $ 17,186 $ 477 $ Balance as of December 31, 2016 (985) $ 4,91 19,285 See accompanying notes to consolidated financial statements. Appendix E Specimen Financial Statements: Wal-Mart Stores, Inc. The following are Wal-Mart Stores, Inc.'s financial statements as presented in the -company's annual report for the year ended January 31, 2017. The complete annual -report, including notes to the financial statements, is available at the company's website. Wal-Mart Stores, Inc. Consolidated Statement of Income Fiscal Years Ended January 31, (Amounts in millions, except per share data) 2017 2016 2015 Revenues: $478,614 3,516 Net sales $481,317 4,556 $482,229 3,422 Membership and other income Total revenues Costs and expenses: Cost of sales Operating, selling, general and administrative expenses 485,873 482,130 485,651 365,086 93,418 360,984 97,041 361,256 101,853 Operating income Interest: Debt 22,764 24,105 27,147 2,044 2,027 2,161 Capital lease and financing obligations 323 521 300 (81) (100) Interest income (113) Interest, net 2,267 2,467 2,348 Income from continuing operations before income taxes Provision for income taxes 20,497 24,799 7,985 21,638 6,558 6,204 Income from continuing operations Income from discontinued operations, net of income taxes 14,293 15,080 16,814 285 Consolidated net income 14,293 (650) 15,080 (386) 17,099 (736) Consolidated net income attributable to noncontrolling interest $ 13,643 $ 14,694 $ 16,363 Consolidated net income attributable to Walmart Basic net income per common share: Basic income per common share from continuing operations attributable to Walmart Basic income per common share from discontinued operations attributable to Walmart 4.58 %24 4.40 5.01 0.06 - Basic net income per common share attributable to Walmart 4.58 5.07 4.40 Diluted net income per common share: Diluted income per common share from continuing operations attributable to Walmart Diluted income per common share from discontinued operations attributable to Walmart 24 0.06 2$ 4.57 4.38 4.99 Diluted net income per common share attributable to Walmart 2$ 4.57 5.05 4.38 Weighted-average common shares outstanding: Basic Diluted 3,207 3,217 3,230 3,243 3,101 3,112 Dividends declared per common share 2.00 1.96 1.92 See accompanying notes. %24 %24 Wal-Mart Stores, Inc. Consolidated Statement of Comprehensive Income Fiscal Years Ended January 31, (Amounts in millions) 2016 2015 2017 Consolidated net income $15,080 (386) $17,099 (736) $14,293 (650) Less consolidated net income attributable to nonredeemable noncontrolling interest Consolidated net income attributable to Walmart 14,694 16,363 13,643 Other comprehensive income (loss), net of income taxes Currency translation and other Net investment hedges Cash flow hedges Minimum pension liability (5,220) 366 (4,558) (2,882) 413 379 (202) 21 (470) (69) (397) 86 Other comprehensive income (loss), net of income taxes Less other comprehensive income (loss) attributable to nonredeemable noncontrolling interest (4,970) 541 (4,718) 546 (2,845) 210 (2,635) Other comprehensive income (loss) attributable to Walmart (4,429) (4,172) Comprehensive income, net of income taxes Less comprehensive income (loss) attributable to nonredeemable noncontrolling interest 11,448 (440) 10,110 155 12,381 (190) Comprehensive income attributable to Walmart $10,265 $12,191 $11,008 See accompanying notes. Wal-Mart Stores, Inc. Consolidated Balance Sheets As of January 31, (Amounts in millons) 2016 2017 ASSETS Current assets: Cash and cash equivalents Receivables, net $ 6,867 $ 8,705 5,835 5,624 44,469 Inventories 43,046 Prepaid expenses and other 1,941 1,441 Total current assets 57,689 60,239 Property and equipment: Property and equipment Less accumulated depreciation 176,958 (66,787) 179,492 (71,782) Property and equipment, net Property under capital lease and financing obligations: Property under capital lease and financing obligations Less accumulated amortization 110,171 107,710 11,637 11,096 (5,169) (4,751) Property under capital lease and financing obligations, net 6,468 6,345 Goodwill 17,037 9,921 16,695 Other assets and deferred charges 6,131 Total assets $199,581 $198,825 LIABILITIES AND EQUITY Current liabilities: $ 1,099 $ 2,708 38,487 Short-term borrowings Accounts payable Accrued liabilities 41,433 19,607 20,654 Accrued income taxes 521 921 Long-term debt due within one year Capital lease and financing obligations due within one year 2,256 2,745 551 565 Total current liabilities 66,928 64,619 Long-term debt Long-term capital lease and financing obligations 38,214 5,816 36,015 6,003 Deferred income taxes and other 7,321 9,344 Commitments and contingencies Equity: Common stock 305 317 Capital in excess of par value Retained earnings Accumulated other comprehensive loss 2,371 1,805 89,354 90,021 (14,232) (11,597) Total Walmart shareholders' equity Nonredeemable noncontrolling interest 77,798 2,737 80,546 3,065 Total equity 83,611 80,535 Total liabilities and equity $199,581 $198,825 See accompanying notes. Wal-Mart Stores, Inc. Consolidated Statements of Shareholders' Equity and Redeemaole Noncontrolling Interest Accumulated Total Walmart Comprehensive Shareholders' Equity Redeemable Noncontrolling Capital in Excess of Other Nonredeemable Common Stock Retained Noncontrolling Total (Amounts in millions) Shares Amount Par Value Earnings Loss Equity Interest Interest $ (2,996) $ 1,491 $2,362 Balances as of February 1, 2014 $323 $5,084 $81,339 17,099 3,233 $76,566 16,363 $76,255 Consolidated net income 16,363 736 Other comprehensive loss, net of income taxes (4,172) (546) (4,172) (4,718) Cash dividends declared ($1.92 per share) Purchase of Company stock Purchase of redeemable (6,185) (950) (6,185) (980) (6,185) (13) (1) (29) (980) noncontrolling interest Other (1,491) 1 129 (17) (731) (618) 113 Balances as of January 31, 2015 Consolidated net income 85,777 14,694 3,228 323 2,462 (7,168) 81,394 4,543 85,937 14,694 386 15,080 Other comprehensive loss, net of income taxes (4,429) (4,429) (541) (4,970) Cash dividends declared ($1.96 per share) Purchase of Company stock Cash dividend declared to (6,294) (6,294) (6,294) (65) (6) (4,256) (102) (4,148) (4,256) noncontrolling interest Other (691) (632) (691) (563) (1,195) (1) (555) (8) Balances as of January 31, 2016 Consolidated net income (11,597) 3,162 317 1,805 90,021 80,546 3,065 83,611 13,643 13,643 14,293 650 || |||| COISUnuateu TIET ICUME T,043 T4,273 Other comprehensive loss, net of income taxes (2,635) (2,635) (210) (2,845) Cash dividends declared (6,216) (8,276) ($2.00 per share) Purchase of Company stock Cash dividend declared to (6,216) (6,216) (8,276) (12) (8,090) (120) (174) noncontrolling interest Other (519) (249) (519) 740 (4) 736 487 $305 $2,371 Balances as of January 31, 2017 3,048 $89,354 $(14,232) $77,798 $2,737 $80,535 See accompanying notes. Wal-Mart Stores, Inc. Consolidated Statements of Cash Flow Fiscal Years Ended January 31, (Amounts in millions) 2017 2016 2015 Cash flows from operating activities: $ 14,293 $ 15,080 $ 17,099 (285) Consolidated net income Income from discontinued operations, net of income taxes Income from continuing operations Adjustments to reconcile income from continuing operations to net cash provided by operating activities: Depreciation and amortization 15,080 16,814 14,293 10,080 9,173 9,454 Deferred income taxes (672) 1,410 761 (503) Other operating activities Changes in certain assets and liabilities, net of effects of acquisitions: Receivables, net 206 785 (402) (19) (703) (569) (1,229) Inventories 1,021 Accounts payable 3,942 2,008 2,678 Accrued liabilities 1,137 1,303 1,249 Accrued income taxes (472) 166 492 Net cash provided by operating activities 27,389 31,530 28,564 Cash flows from investing activities: Payments for property and equipment Proceeds from the disposal of property and equipment Proceeds from the disposal of certain operations Purchase of available for sale securities (10,619) (11,477) (12,174) 635 570 456 662 671 246 (1,901) Investment and business acquisitions, net of cash acquired (2,463) Investment and business acquisitions, net of cash acquired Other investing activities (2,463) (122) (79) (192) Net cash used in investing activities (13,987) (10,675) (11,125) Cash flows from financing activities: Net change in short-term borrowings Proceeds from issuance of long-term debt Payments of long-term debt Dividends paid Purchase of Company stock Dividends paid to noncontrolling interest Purchase of noncontrolling interest Other financing activities 1,235 (6,288) 5,174 (3,904) (6,185) (1,673) 39 137 (2,055) (6,216) (8,298) (4,432) (6,294) (4,112) (719) (1,326) (513) (1,015) (479) (90) (255) (600) (1,844) (409) Net cash used in financing activities (18,929) (16,122) (15,071) Effect of exchange rates on cash and cash equivalents (1,022) (452) (514) Net increase (decrease) in cash and cash equivalents Cash and cash equivalents at beginning of year 1,854 7,281 (1,838) (430) 9,135 8,705 $ 8,705 Cash and cash equivalents at end of year $ 6,867 $ 9,135 Supplemental disclosure of cash flow information: Income taxes paid Interest paid 4,507 8,111 8,169 2,433 2,351 2,540 See accompanying notes. Amazon.com, Inc.'s financial statements are presented in Appendix D. Click here to view Appendix D. Financial statements of Wal-Mart Stores, Inc. are presented in Appendix E. Click here to view Appendix E. (a) Based on the information contained in these financial statements, compute free cash flow for Amazon at December 31, 2016 and Wal-Mart for January 31, 2017. (Show a negative free cash flow with either a - sign e.g. -15,000 or in parenthesis e.g. (15,000). Enter amounts in millions.) Wal-Mart Stores, Inc. Amazon.com, Inc. Free cash flow