 AMC Entertainment Holdings Inc.
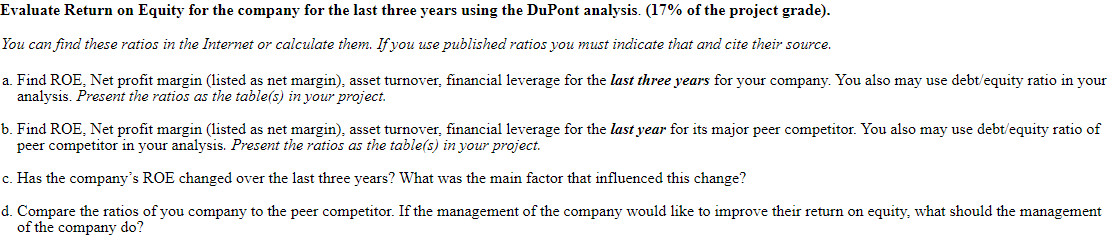
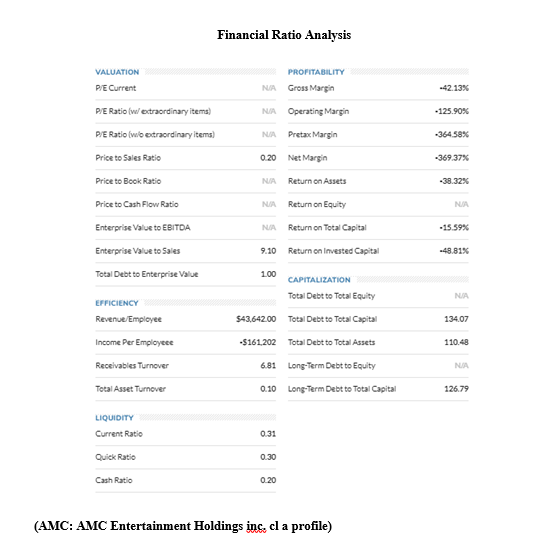
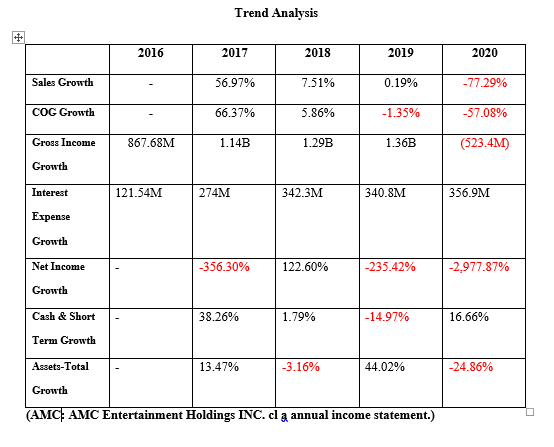
Financial Ratio Analysis PROFITABILITY Gross Margin NA -42.13% NA Operating Margin -125,90% NA Preta Margin -364.58% 0.20 Net Margin -369.37% VALUATION PE Current PE Ratio (w/ extraordinary items) PE Ratio (wo extraordinary items) Price to Sales Ratio Price to Book Ratio Price to Cash Flow Ratio Enterprise Value to EBITDA Enterprise Value to Sales Total Debt to Enterprise Valve NA Return on Assets -38.32% NA Return on Equity NA NA Return on Total Capital -15.59% 9.10 Return on invested Capital -48.81% 1.00 NA 134.07 EFFICIENCY Revenue/Employee Income Per Employee Receivables Turnover Total Asset Turnover CAPITALIZATION Total Debt to Total Equity $43,642.00 Total Debt to Total Capital -5161202 Total Debt to Total Assets 6.81 Long-Term Debt to Equity 0.10 Long-Term Debt to Total Capital 110.48 NUA 126.79 LIQUIDITY Current Ratio 0.31 Quick Ratio 0.30 Cash Ratio 0.20 (AMC: AMC Entertainment Holdings inc. cl a profile) Trend Analysis 2016 2017 2018 2019 2020 Sales Growth 56.97% 7.51% 0.19% -77.29% COG Growth 66.37% 5.86% -1.35% -57.08% Gross Income 867.68M 1.14B 1.29B 1.36B (523.4M) Growth Interest 121.54M 274M 342.3M 340.8M 356.9M Expense Growth Net Income -356.30% 122.60% -235.42% -2,977.87% Growth Cash & Short 38.26% 1.79% -14.97% 16.66% Term Growth Assets-Total 13.47% -3.16% 44.02% -24.86% Growth (AMC AMC Entertainment Holdings INC. cl a annual income statement.) Evaluate Return on Equity for the company for the last three years using the DuPont analysis. (17% of the project grade). You can find these ratios in the Internet or calculate them. If you use published ratios you must indicate that and cite their source. a. Find ROE, Net profit margin (listed as net margin), asset turnover, financial leverage for the last three years for your company. You also may use debt/equity ratio in your analysis. Present the ratios as the table(s) in your project. b. Find ROE. Net profit margin (listed as net margin), asset turnover, financial leverage for the last year for its major peer competitor. You also may use debt/equity ratio of peer competitor in your analysis. Present the ratios as the table(s) in your project. c. Has the company's ROE changed over the last three years? What was the main factor that influenced this change? d. Compare the ratios of you company to the peer competitor. If the management of the company would like to improve their return on equity, what should the management of the company do? Financial Ratio Analysis PROFITABILITY Gross Margin NA -42.13% NA Operating Margin -125,90% NA Preta Margin -364.58% 0.20 Net Margin -369.37% VALUATION PE Current PE Ratio (w/ extraordinary items) PE Ratio (wo extraordinary items) Price to Sales Ratio Price to Book Ratio Price to Cash Flow Ratio Enterprise Value to EBITDA Enterprise Value to Sales Total Debt to Enterprise Valve NA Return on Assets -38.32% NA Return on Equity NA NA Return on Total Capital -15.59% 9.10 Return on invested Capital -48.81% 1.00 NA 134.07 EFFICIENCY Revenue/Employee Income Per Employee Receivables Turnover Total Asset Turnover CAPITALIZATION Total Debt to Total Equity $43,642.00 Total Debt to Total Capital -5161202 Total Debt to Total Assets 6.81 Long-Term Debt to Equity 0.10 Long-Term Debt to Total Capital 110.48 NUA 126.79 LIQUIDITY Current Ratio 0.31 Quick Ratio 0.30 Cash Ratio 0.20 (AMC: AMC Entertainment Holdings inc. cl a profile) Trend Analysis 2016 2017 2018 2019 2020 Sales Growth 56.97% 7.51% 0.19% -77.29% COG Growth 66.37% 5.86% -1.35% -57.08% Gross Income 867.68M 1.14B 1.29B 1.36B (523.4M) Growth Interest 121.54M 274M 342.3M 340.8M 356.9M Expense Growth Net Income -356.30% 122.60% -235.42% -2,977.87% Growth Cash & Short 38.26% 1.79% -14.97% 16.66% Term Growth Assets-Total 13.47% -3.16% 44.02% -24.86% Growth (AMC AMC Entertainment Holdings INC. cl a annual income statement.) Evaluate Return on Equity for the company for the last three years using the DuPont analysis. (17% of the project grade). You can find these ratios in the Internet or calculate them. If you use published ratios you must indicate that and cite their source. a. Find ROE, Net profit margin (listed as net margin), asset turnover, financial leverage for the last three years for your company. You also may use debt/equity ratio in your analysis. Present the ratios as the table(s) in your project. b. Find ROE. Net profit margin (listed as net margin), asset turnover, financial leverage for the last year for its major peer competitor. You also may use debt/equity ratio of peer competitor in your analysis. Present the ratios as the table(s) in your project. c. Has the company's ROE changed over the last three years? What was the main factor that influenced this change? d. Compare the ratios of you company to the peer competitor. If the management of the company would like to improve their return on equity, what should the management of the company do