Answered step by step
Verified Expert Solution
Link Copied!

Question

1 Approved Answer

An article in the Journal of the Environmental Engineering Division (Distribution of Toxic Substances in Rivers, Vol 108, 1982 pp.639-649) describes a study of the
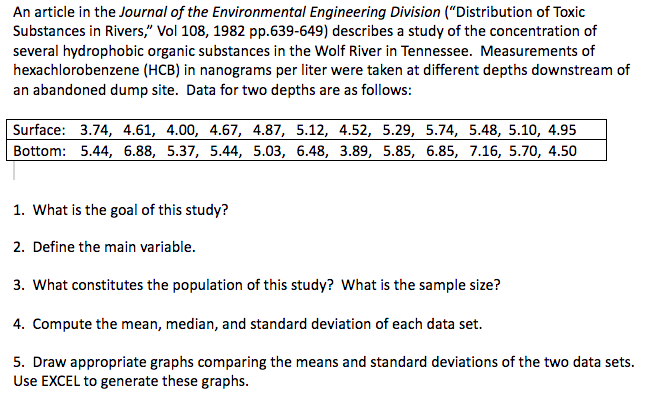
image text in transcribed
An article in the Journal of the Environmental Engineering Division ("Distribution of Toxic Substances in Rivers," Vol 108, 1982 pp.639-649) describes a study of the concentration of several hydrophobic organic substances in the Wolf River in Tennessee. Measurements of hexachlorobenzene (HCB) in nanograms per liter were taken at different depths downstream of an abandoned dump site. Data for two depths are as follows: Surface: 3.74, 4.61, 4.00, 4.67, 4.87, 5.12, 4.52, 5.29, 5.74, 5.48, 5.10, 4.95 Bottom: 5.44, 6.88, 5.37, 5.44, 5.03, 6.48, 3.89, 5.85, 6.85, 7.16, 5.70, 4.50 1. What is the goal of this study? 2. Define the main variable. 3. What constitutes the population of this study? What is the sample size? 4. Compute the mean, median, and standard deviation of each data set. 5. Draw appropriate graphs comparing the means and standard deviations of the two data sets. Use EXCEL to generate these graphs

Step by Step Solution

There are 3 Steps involved in it

Step: 1

blur-text-image

Get Instant Access to Expert-Tailored Solutions

See step-by-step solutions with expert insights and AI powered tools for academic success

Step: 2

blur-text-image

Step: 3

blur-text-image

Ace Your Homework with AI

Get the answers you need in no time with our AI-driven, step-by-step assistance

Get Started

Recommended Textbook for

Algebra And Trigonometry

Authors: Cynthia Y Young

5th Edition

1119820898, 9781119820895

More Books

Students also viewed these Mathematics questions

Question

5. Identify three characteristics of the dialectical approach.

Answered: 1 week ago

Question

6. Explain the strengths of a dialectical approach.

Answered: 1 week ago

Question

4. Explain the strengths and weaknesses of each approach.

Answered: 1 week ago