An ecologist is interested is whether there is a relationship between mean size of the leaves an oak trees and distance from the road because
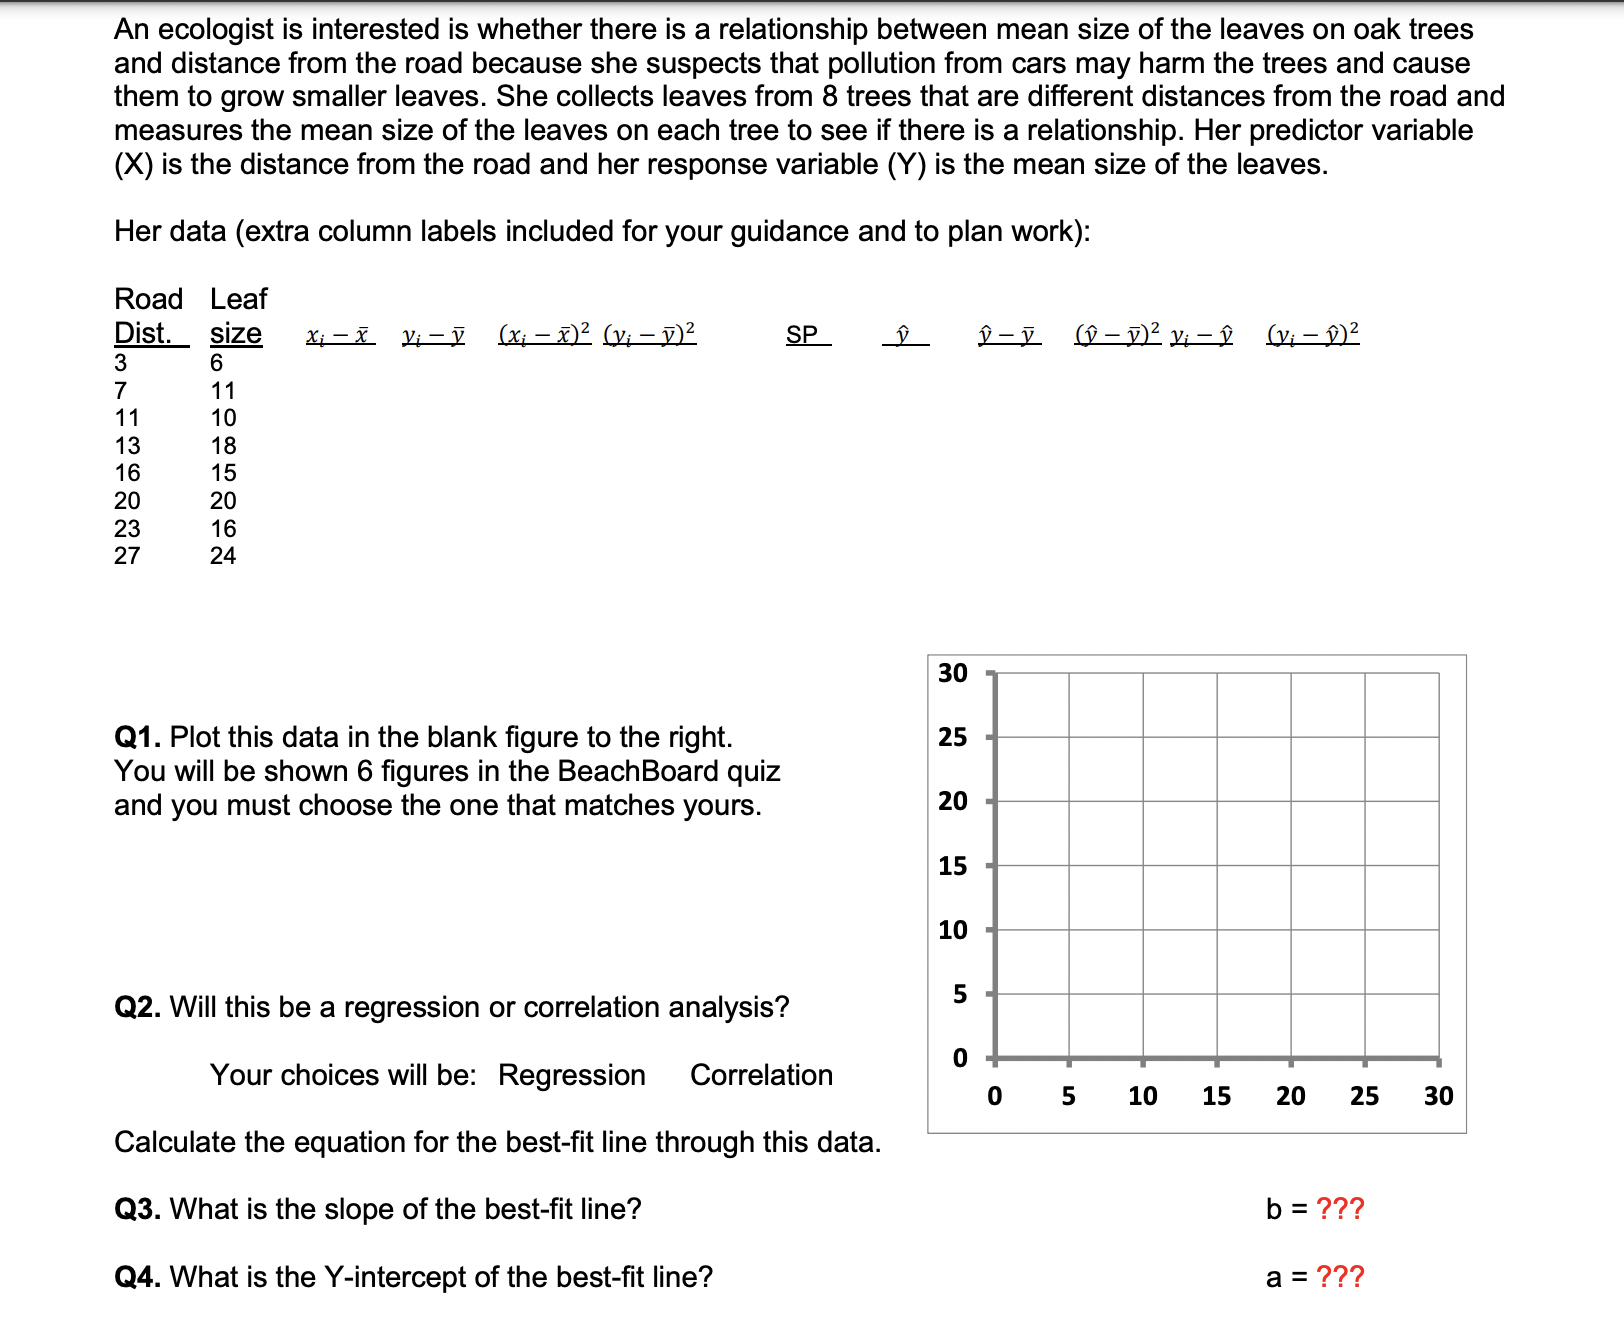
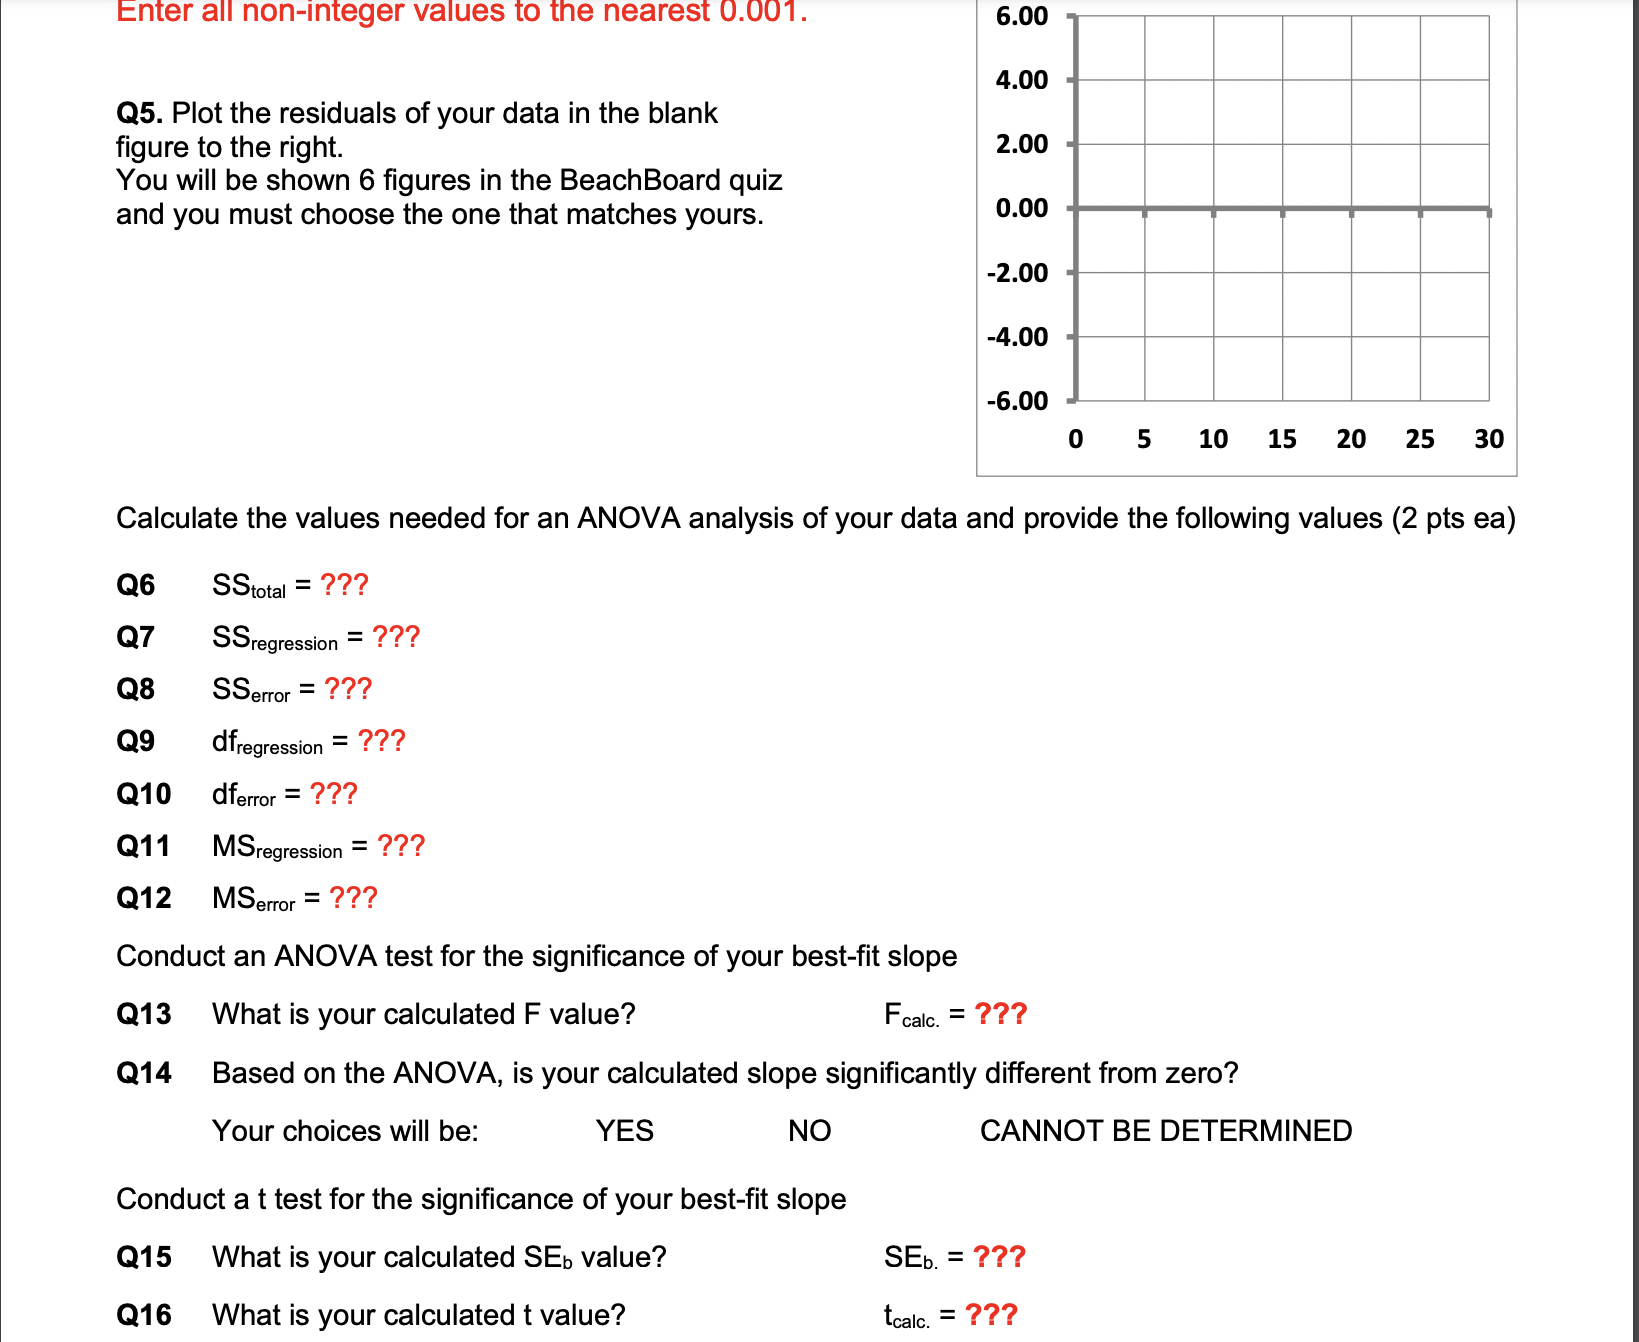
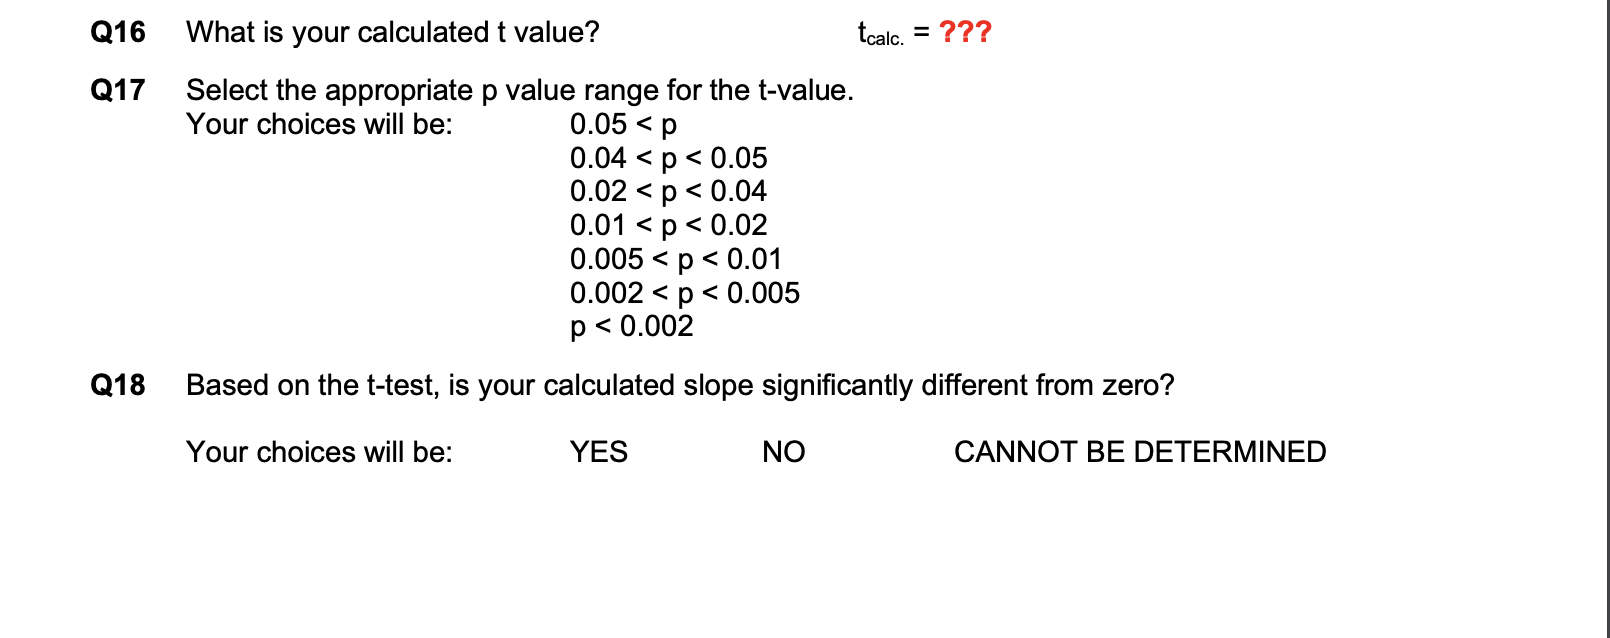
An ecologist is interested is whether there is a relationship between mean size of the leaves an oak trees and distance from the road because she suspects that pollution from cars may harm the trees and cause them to grow smaller leaves. She collects leaves from 8 trees that are different distances from the road and measures the mean size of the leaves on each tree to see if there is a relationship. Her predictor variable (X) is the distance from the road and her response variable (Y) is the mean size of the leaves. Her data (extra column labels included for your guidance and to plan work): Road Leaf Dist. size xiJ? nj x;f)2(l-JZ)2 SP _L 3337 (-Ezm- (Jar-5W 3 5 7 11 11 10 13 18 16 15 20 20 23 16 27 24 Q1. Plot this data in the blank gure to the right. You will be shown 6 gures in the BeachBoard quiz and you must choose the one that matches yours. 02. Will this be a regression or correlation analysis? Your choices will be: Regression Correlation Calculate the equation for the best-fit line through this data. Q3. What is the slope of the best-fit line? b = ??? Q4. What is the Y-intercept of the best-t line? a = ??? Enter all non-integer values to the nearest 0.001. 6.00 4.00 Q5. Plot the residuals of your data in the blank figure to the right. 2.00 You will be shown 6 figures in the BeachBoard quiz and you must choose the one that matches yours. 0.00 -2.00 -4.00 -6.00 0 5 10 15 20 25 30 Calculate the values needed for an ANOVA analysis of your data and provide the following values (2 pts ea) Q6 SStotal = ??? Q7 SSregression = ??? Q8 SSerror = ??? Q9 dfregression = ??? Q10 dferror = ??? Q11 MSregression = ??? Q12 MSerror = ??? Conduct an ANOVA test for the significance of your best-fit slope Q13 What is your calculated F value? Fcalc. = ??? Q14 Based on the ANOVA, is your calculated slope significantly different from zero? Your choices will be: YES NO CANNOT BE DETERMINED Conduct a t test for the significance of your best-fit slope Q15 What is your calculated SEb value? SEb. = ??? Q16 What is your calculated t value? tcalc. = ???Q16 What is your calculated t value? teal; = 7?? Q17 Select the appropriate p value range for the t-value. Your choices will be: 0.05
Step by Step Solution
There are 3 Steps involved in it
Step: 1
Get Instant Access to Expert-Tailored Solutions
See step-by-step solutions with expert insights and AI powered tools for academic success
Step: 2
Step: 3
Ace Your Homework with AI
Get the answers you need in no time with our AI-driven, step-by-step assistance