Answered step by step
Verified Expert Solution
Link Copied!

Question

1 Approved Answer

An economist wanted to analyze the relationship between the speed of a truck (x) and its gas mileage (y). As an experiment a truck is

image text in transcribed
An economist wanted to analyze the relationship between the speed of a truck (x) and its gas mileage (y). As an experiment a truck is operated at several different speeds and for each speed the gas mileage is measured. These data are shown below. Speed 25 35 45 50 60 65 70 Gas Mileage 43 38 37 30 29 26 23 Assume normality of variables. a) Calculate the coefficient of correlation r. Provide an interpretation of the computed value of r. (9 marks) b) Calculate the coefficient de determination r square (R2). Provide an interpretation of the computed value of r square (R2). (3 marks) c) Determine the least squares line. Provide an interpretation of your results. (8 marks)

Step by Step Solution

There are 3 Steps involved in it

Step: 1

blur-text-image

Get Instant Access to Expert-Tailored Solutions

See step-by-step solutions with expert insights and AI powered tools for academic success

Step: 2

blur-text-image

Step: 3

blur-text-image

Ace Your Homework with AI

Get the answers you need in no time with our AI-driven, step-by-step assistance

Get Started

Recommended Textbook for

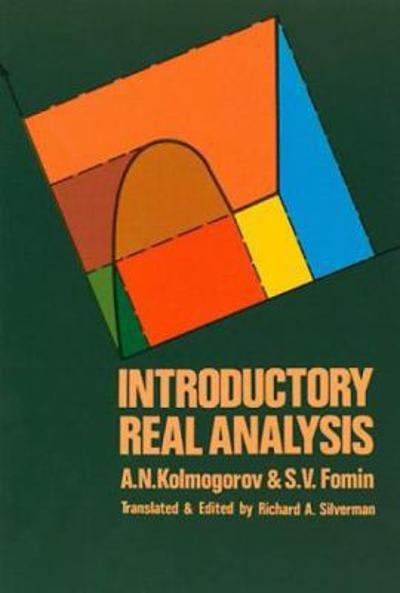
Introductory Real Analysis

Authors: A N Kolmogorov, S V Fomin, Richard A Silverman

1st Edition

0486134741, 9780486134741

More Books

Students also viewed these Mathematics questions