

Question
An experiment was conducted in which two fair dice were thrown 100 times. The sum of the pips showing on the dice was then recorded.
An experiment was conducted in which two fair dice were thrown 100 times. The sum of the pips showing on the dice was then recorded. The following frequency histogram gives the results. Use the histogram to complete the following.
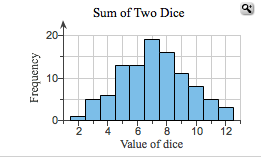
1. What was hte most frequent outcome of the experiment?
2. What was the least frequent?
3. How many times did we observe 3?
4. Determine the percentage of the time a 3 was observed.
5. Describe the shape of the distribution.
a. bell shaped
b. skewed left
c. skewed right
d. uniform
Step by Step Solution
There are 3 Steps involved in it
Step: 1

Get Instant Access to Expert-Tailored Solutions
See step-by-step solutions with expert insights and AI powered tools for academic success
Step: 2

Step: 3
Ace Your Homework with AI
Get the answers you need in no time with our AI-driven, step-by-step assistance
Get Started
Financial Development Institutions Growth And Poverty Reduction
Authors: Basudeb Guha Khasnobis, George Mavrotas
2008 Edition
0230201776, 978-0230201774