Answered step by step
Verified Expert Solution
Question
1 Approved Answer
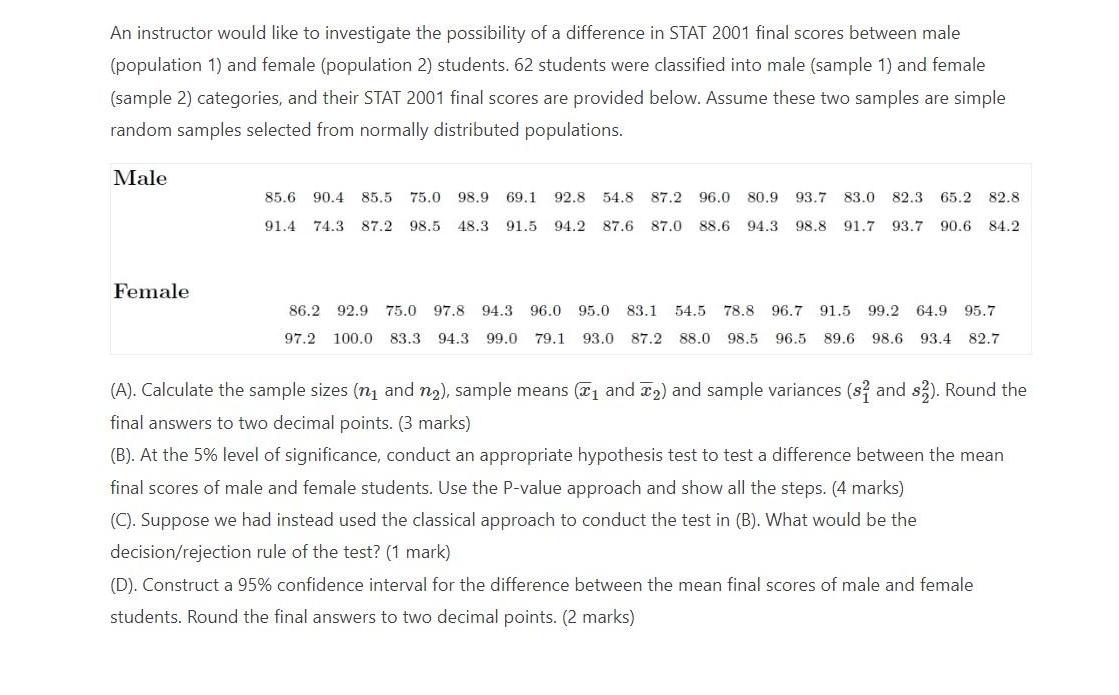
An instructor would like to investigate the possibility of a difference in STAT 2001 final scores between male (population 1) and female (population 2)

An instructor would like to investigate the possibility of a difference in STAT 2001 final scores between male (population 1) and female (population 2) students. 62 students were classified into male (sample 1) and female (sample 2) categories, and their STAT 2001 final scores are provided below. Assume these two samples are simple random samples selected from normally distributed populations. Male Female 85.6 90.4 85.5 75.0 98.9 69.1 92.8 54.8 87.2 96.0 80.9 93.7 83.0 82.3 65.2 82.8 91.4 74.3 87.2 98.5 48.3 91.5 94.2 87.6 87.0 88.6 94.3 98.8 91.7 93.7 90.6 84.2 86.2 92.9 75.0 97.8 94.3 96.0 95.0 83.1 54.5 78.8 96.7 91.5 99.2 64.9 95.7 97.2 100.0 83.3 94.3 99.0 79.1 93.0 87.2 88.0 98.5 96.5 89.6 98.6 93.4 82.7 (A). Calculate the sample sizes (n and n), sample means ( and ) and sample variances (s2 and s2). Round the final answers to two decimal points. (3 marks) (B). At the 5% level of significance, conduct an appropriate hypothesis test to test a difference between the mean final scores of male and female students. Use the P-value approach and show all the steps. (4 marks) (C). Suppose we had instead used the classical approach to conduct the test in (B). What would be the decision/rejection rule of the test? (1 mark) (D). Construct a 95% confidence interval for the difference between the mean final scores of male and female students. Round the final answers to two decimal points. (2 marks)
Step by Step Solution
★★★★★
3.46 Rating (143 Votes )
There are 3 Steps involved in it
Step: 1

Get Instant Access to Expert-Tailored Solutions
See step-by-step solutions with expert insights and AI powered tools for academic success
Step: 2

Step: 3

Ace Your Homework with AI
Get the answers you need in no time with our AI-driven, step-by-step assistance
Get Started


