

Question
An Internet media and market research firm measured the amount of time an individual spends viewing a specific Webpage The data in the accompanying table

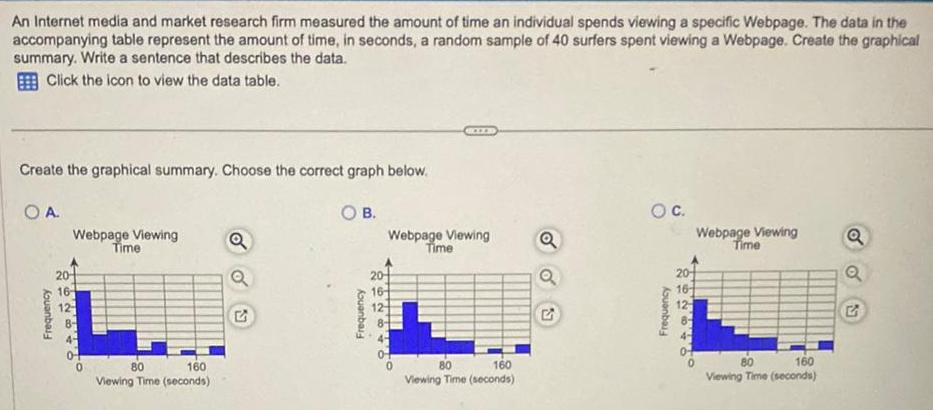
An Internet media and market research firm measured the amount of time an individual spends viewing a specific Webpage The data in the accompanying table represent the amount of time in seconds a random sample of 40 surfers spent viewing a Webpage Create the graphical summary Write a sentence that describes the data Click the icon to view the data table Create the graphical summary Choose the correct graph below OA O B Frequency 16 Webpage Viewing Time 80 160 Viewing Time seconds Q S Frequency 26264 20 16 Webpage Viewing Time 12 8 80 160 Viewing Time seconds Q O C Frequency 16 Webpage Viewing Time 80 160 Viewing Time seconds Q Q
Step by Step Solution
There are 3 Steps involved in it
Step: 1

Get Instant Access to Expert-Tailored Solutions
See step-by-step solutions with expert insights and AI powered tools for academic success
Step: 2

Step: 3
Ace Your Homework with AI
Get the answers you need in no time with our AI-driven, step-by-step assistance
Get Started
Elementary Differential Geometry
Authors: Barrett O'Neill
1st Edition
148326811X, 9781483268118