Answered step by step
Verified Expert Solution
Question
1 Approved Answer
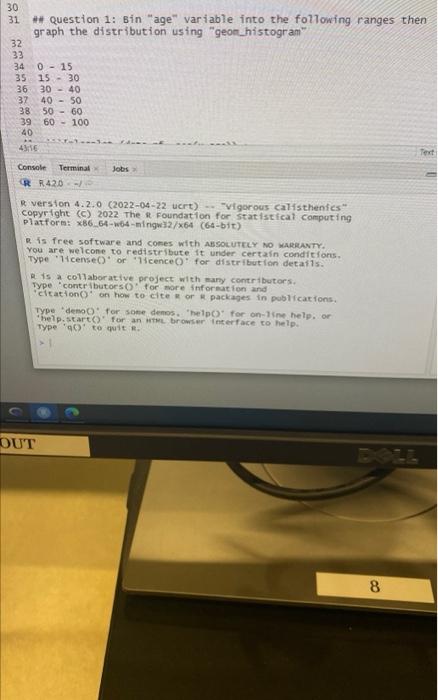
AN Question 1: Bin age variable into the following ranges then graph the distribution using geon histogram 323334353637383940015153030=4040=50506060=100 R verston 4.2.0 (2022-04-22 ucrt) * Vigorous

Step by Step Solution
There are 3 Steps involved in it
Step: 1

Get Instant Access to Expert-Tailored Solutions
See step-by-step solutions with expert insights and AI powered tools for academic success
Step: 2

Step: 3

Ace Your Homework with AI
Get the answers you need in no time with our AI-driven, step-by-step assistance
Get Started


