analysis and discussion of the income statement and balance sheet for Procter and gamble as at June 30 2018.compared to that of June 30, 2017.
Please make sure your written paper includes answers to the following questions:
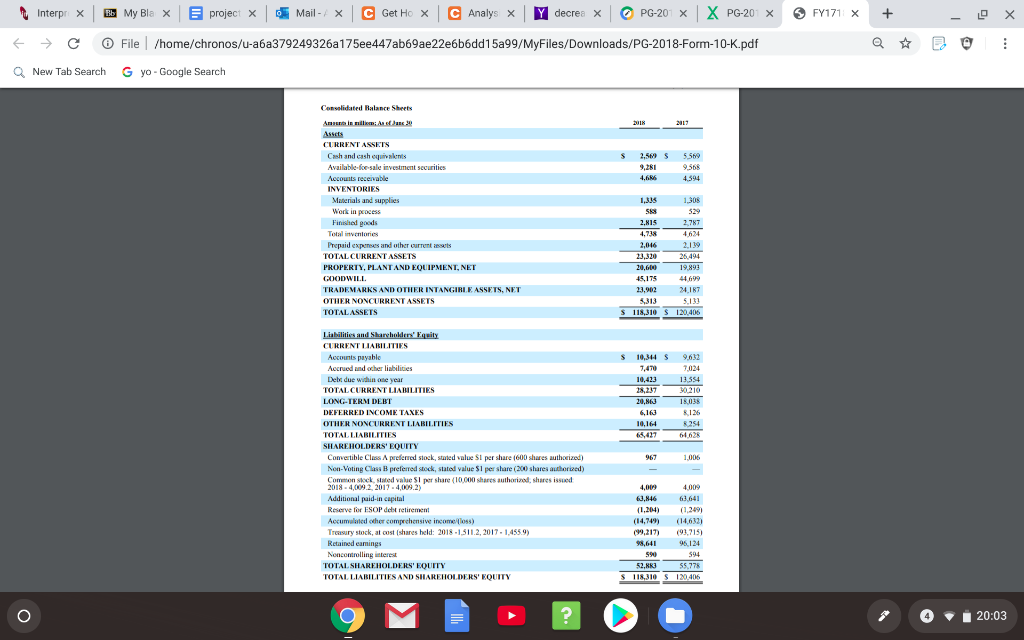
4. How much cash and cash equivalents did the company have at the end of its 2 most recent annual reporting periods?
5. What were the companys total current assets at the end of its 2 most recent annual reporting periods?
6. What were the two largest current assets at the end of its 2 most recent annual reporting periods?
7. What were the companys total assets at the end of its 2 most recent annual reporting periods?
8. What amount of accounts payable did the company have at the end of its 2 most recent annual reporting periods?
9. What were the companys total current liabilities at the end of its 2 most recent annual reporting periods?
10. What were the companys total liabilities and shareholders equity at the end of its 2 most recent annual reporting periods?
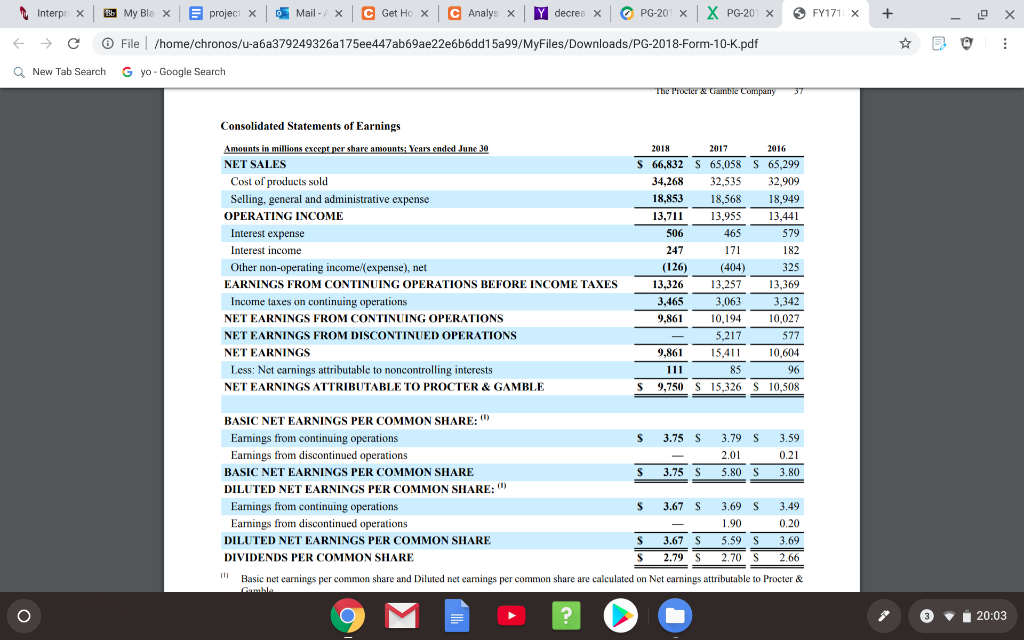
11. What were the companys revenues (or net revenues) for the last 2 annual reporting periods?
12. Besides reporting numbers you need to provide some analysis such as increase decrease, percentage change, or any ratios you might find useful to explain changes in the financials of the company you chose.
FY171 x Interpr X BMy Bla X C Analy Y decrea X PG-201 x XPG-20 x c Get HoX projectX Mail X X File /home/chronos/u-a6a379249326a175ee447ab69ae22e6b6dd15a99/MyFiles/Downloads/PG-2018-Form-10-K.pdf Q New Tab Search G yo-Google Search Coneelidated Balance Shets s 2017 Ansuo in lik: As ofJane 30 Assets TASSETS Cash and cash equivakents Available-foe-sale investment securities 5 560 2.569 s 9568 9.28 4,680 4.594 INVENTORIES Marials and supplies 1.335 308 Fisish 464 Tetal inventories 4738 epaid expenes and other current ts 2,04s 2,199 19 891 PROPERTY, PLLANTAND EQUIPMENT, NET 20 6l8 GOODWILL 45.175 44699 INTANGIRLE ASSETS, NET OTHER NONCURRENT ASSETS 5313 s 118,310 120,406 TOTALASSETS Liabilities and Sharcholders' Equity CLRRENT LIARILITIES 10,344 9,052 Acconts payan liabilities Debe due wihin one vear 10 42 13.554 30210 TOTAL CURRENT LIABILITIES 28.237 DEFERRED INCOME TANES 6163 136 OTHER NONCURRENT LIABILITIES 10 164 8254 65.427 64,628 FHARCHOLDERS FOUITY Convetible Class A preferred stock, stated value S1 per share (600 shares authoeized) 96 Non-Voting Class B prefered stock, stated value $1 per share (200 shares authorized) 019 0 30174 pr share (10,000 shares authorized, shares issued Additional paid-in capital 4009 4.00% 6364 63,846 Aprumuluded e e incomeloss) (14,749 (14.632) Treasury stock, at cost (shares held: 2018-1511.2, 2017-1,455.9) 99.217) (93,715 KEined eamings terest TOTAL SHAREHOLDERS EQUTY TOTAL LIABILITIES AND SHAREHOLDERS' EQUITY 52.883 $5.778 s118.310 S 120406 20:03 FY171 x C Analy Y decrea X PG-20 x XPG-201 x BbMy Bla X c Get HoX projectX Mail + Interp X X File /home/chronos/u-a6a379249326a175ee447ab69ae22e6b6dd15a99/MyFiles/Downloads/PG-2018-Form-10-K.pdf Q New Tab Search G yo-Google Search Uamble Company The Procter Consolidated Statements of Earnings Amounts in millions except per share amounts; Years ended June 30 2018 2017 2016 S 66.832 S 65.058 S 65.299 NET SALES Cost of products sold 34,268 32.535 32,909 Selling, general and administrative expense 18,853 18,568 18,949 13,44 OPERATING INCOME 13,711 13.955 Interest expense 506 465 579 Interest income 247 171 182 (126 Other non-operating income/(expense), net (404) 325 13.369 EARNINGS FROM CONTINUING OPERATIONS BEFORE INCOME TAXES 13.326 13.257 Income taxes on continuing operations NET EARNINGS FROM CONTINUING OPERATIONS NET EARNINGS FROM DISCONTINUED OPERATIONS NET EARNINGS 3.063 3.465 3.342 9.861 10.194 10,027 5.217 577 9.861 15,411 10.604 Less: Net carnings attributable to noncontrolling interests NET EARNINGS ATTRIBUTABLE TO PROCTER & GAMBLE 85 l11 96 S 10,508 9,750 15,326 BASIC NET EARNINGS PER COMMON SHARE: 3.79 S Eamings from continuing operations S 3.75 S 3.59 Eamings from discontinued operations 0 21 2.01 BASIC NET EARNINGS PER COMMON SHARE 3.75 5.80 S 80 DILUTED NET EARNINGS PER COMMON SHARE: Earmings from continuing operations Eamings from discontinued operations S 3.67 S 3.69 S 3 49 0 20 1,90 DILUTED NET EARNINGS PER COMMON SHARE DIVIDENDS PER COMMON SHARE S 3.67 3.69 5.59 S 2.79 2,70 S 2.66 Basic net earnings per common share and Diluted net eamings per common share are calculated on Net earnings attributable to Procter & 20:03