Answered step by step
Verified Expert Solution
Question
1 Approved Answer
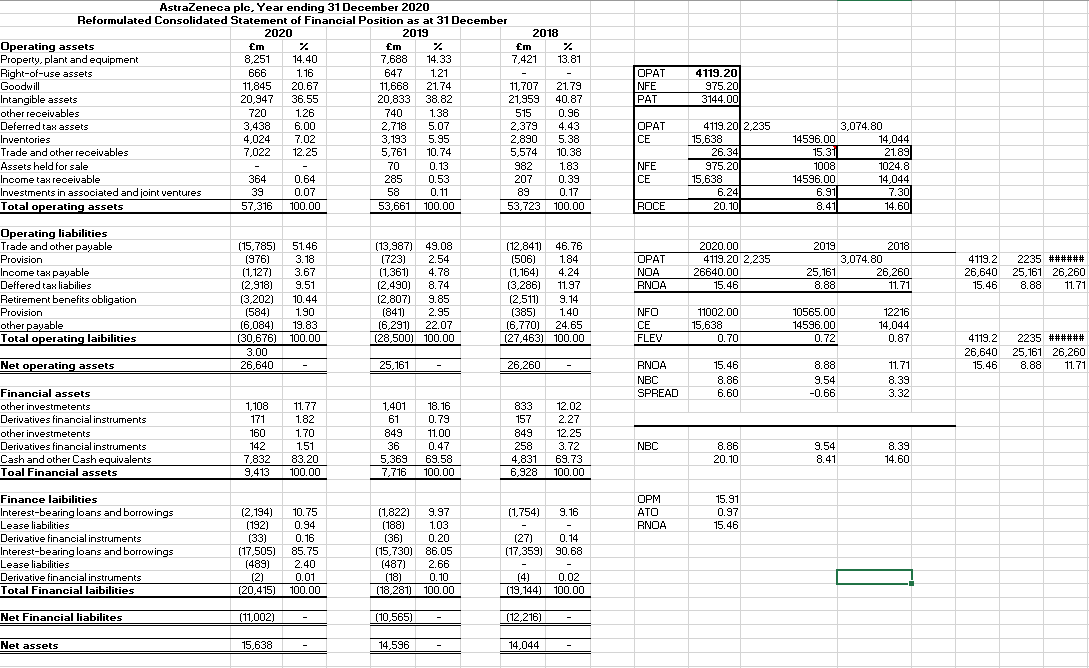
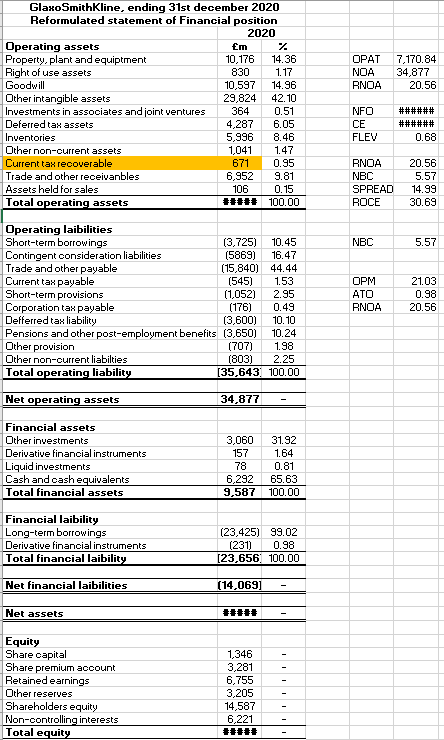
Analysis and Interpretation of Probability and Solvency Ratios - Summarize the results of the ROCE of the chosen company for the three most recent financial
Analysis and Interpretation of Probability and Solvency Ratios
- Summarize the results of the ROCE of the chosen company for the three most recent financial years and its benchmark company for one most recent financial years
- Critically evaluate and discuss the ROCE drivers
Chosen Company: AstraZeneca
Benchmark Company: GlaxoSmithKline
Recent financial years are 2020-2019-2018
How do the ROCE drivers occur and where is the money coming in and out from?


2019 OPAT NFE PAT 4119.20 975.20 3144.00 AstraZeneca plc, Year ending 31 December 2020 Reformulated Consolidated Statement of Financial Position as at 31 December 2020 2018 Operating assets Em 7 Em % Em % Property, plant and equipment 8,251 14.40 7,688 14.33 7,421 13.81 Right-of-use assets 666 1.16 647 1.21 Goodwill 11,845 20.67 11,668 21.74 11,707 21.79 Intangible assets 20,947 36.55 20,833 38.82 21,959 40.87 other receivables 720 1.26 740 1.38 515 0.96 Deferred tax assets 3,438 6.00 2,718 5.07 2.379 4.43 Inventories 4,024 7.02 3,193 5.95 2,890 5.38 Trade and other receivables 7,022 12.25 5.761 10.74 5.574 10.38 Assets held for sale 70 0.13 982 1.83 Income tax receivable 364 0.64 285 0.53 207 0.39 Investments in associated and joint ventures 39 0.07 58 0.11 89 0.17 Total operating assets 57,316 100.00 53,661 100.00 53,723 100.00 OPAT CE NFE CE 4119.20 2.235 15,638 26.34 975.20 15,638 6.24 20.10 3,074.80 14596.00 14,044 15.31 21.89 1008 1024.8 14596.00 14,044 6.91 7.30 8.41 14.60 ROCE Operating liabilities Trade and other payable Provision Income tax payable Deffered tax liabilies Retirement benefits obligation Provision other payable Total operating laibilities OPAT NOA RNOA 2020.00 4119.20 2,235 26640.00 15.46 2019 2018 3,074.80 25,161 26,260 8.88 11.71 4119.2 26,640 15.46 (15,785) (976) (1,127) (2.918) (3,202) (584) (6,084) (30,676) 3.00 26,640 51.46 3.18 3.67 9.51 10.44 1.90 19.83 100.00 (13,987) 49.08 (723) 2.54 (1,361) 4.78 (2,490) 8.74 (2,807) 9.85 (841) (6,291) 22.07 (28,500) 100.00 2235 ###### 25,161 26,260 8.88 11.71 ( (12,841) 46.76 (506) 1.84 (1,164) 4.24 (3,286) 11.97 (2,511) 9.14 (385) 1.40 (6,770) 24.65 (27,463) 100.00 2.95 NFO CE FLEV 11002.00 15,638 0.70 10565.00 14596.00 0.72 12216 14,044 0.87 4119.2 2235 ###### 26,640 25,161 26,260 15.46 8.88 11.71 Net operating assets 25,161 26,260 RNOA NBC SPREAD 15.46 8.86 6.60 8.88 9.54 -0.66 11.71 8.39 3.32 Financial assets other investmetents Derivatives financial instruments other investmetents Derivatives financial instruments Cash and other Cash equivalents Toal Financial assets 1,10 171 160 142 7,832 9,413 11.77 1.82 1.70 1.51 83.20 100.00 1,401 61 849 36 5,369 7,716 18.16 0.79 11.00 0.47 69.58 100.00 833 157 849 258 4,831 6.928 12.02 2.27 12.25 3.72 69.73 100.00 NBC 8.86 20.10 9.54 8.41 8.39 14.60 (1,754) 9.16 OPM ATO RNOA 15.91 0.97 15.46 Finance laibilities Interest-bearing loans and borrowings Lease liabilities Derivative financial instruments Interest-bearing loans and borrowings Lease liabilities Derivative financial instruments Total Financial laibilities (2,194) (192) (33) (17,505) (489) (2) (20,415) 10.75 0.94 0.16 85.75 2.40 0.01 100.00 (1,822) (188) ) (36) (15,730) (487) (18) (18,281) ) 9.97 1.03 0.20 86.05 2.66 0.10 100.00 (27) 0.14 (17,359) 90.68 (4) (19,144) 0.02 100.00 Net Financial liabilites (11,002) (10,565) Street (12,216) ) Net assets 15,638 14,596 14,044 328 Equity Share capital Share premium account Capital redemption reserve Merger reserve Other reserves Retained earnings 7,971 153 448 1,423 5,299 15,622 16 15,638 328 7,941 153 448 1,445 2,812 13,127 1,469 14,596 317 4,427 153 448 1,440 5,683 12,468 1,576 14,044 Non-Controlling interests Total equity OPAT NOA RNOA 7.170.84 34,877 20.56 GlaxoSmithKline, ending 31st december 2020 Reformulated statement of Financial position 2020 Operating assets Em Property, plant and equipment 10,176 14.36 Right of use assets 830 1.17 Goodwill 10,597 14.96 Other intangible assets 29,824 42.10 Investments in associates and joint ventures 364 0.51 Deferred tax assets 4,287 6.05 Inventories 5,996 8.46 Other non-ourrent assets 1,041 1.47 Current tax recoverable 671 0.95 Trade and other receivanbles 6,952 9.81 Assets held for sales 106 0.15 Total operating assets ##### 100.00 NFO CE FLEV ###### ###### 0.68 RNOA NBC SPREAD ROCE 20.56 5.57 14.99 30.69 NBC 5.57 Operating laibilities Short-term borrowings (3,725) 10.45 Contingent consideration liabilities (5869) 16.47 Trade and other payable (15,840) 44.44 Current tax payable (545) 1.53 Short-term provisions (1,052) 2.95 Corporation tax payable (176) 0.49 Defferred tax liability (3,600) 10.10 Pensions and other post-employment benefits (3,650) 10.24 Other provision (707) 1.98 Other non-current liabilties (803) 2.25 Total operating liability (35,643 100.00 OPM ATO RNOA 21.03 0.98 20.56 Net operating assets 34,877 Financial assets Other investments Derivative financial instruments Liquid investments Cash and oash equivalents Total financial assets 3,060 157 78 6,292 9,587 31.92 1.64 0.81 65.63 100.00 Financial laibility Long-term borrowings Derivative financial instruments Total financial laibility (23,425) 99.02 (231) 0.98 (23,656, 100.00 Net financial laibilities (14,069) Net assets ##### Equity Share capital Share premium account Retained earnings Other reserves Shareholders equity Non-controlling interests Total equity 1,346 3,281 6.755 3,205 14,587 6,221 ##### 2019 OPAT NFE PAT 4119.20 975.20 3144.00 AstraZeneca plc, Year ending 31 December 2020 Reformulated Consolidated Statement of Financial Position as at 31 December 2020 2018 Operating assets Em 7 Em % Em % Property, plant and equipment 8,251 14.40 7,688 14.33 7,421 13.81 Right-of-use assets 666 1.16 647 1.21 Goodwill 11,845 20.67 11,668 21.74 11,707 21.79 Intangible assets 20,947 36.55 20,833 38.82 21,959 40.87 other receivables 720 1.26 740 1.38 515 0.96 Deferred tax assets 3,438 6.00 2,718 5.07 2.379 4.43 Inventories 4,024 7.02 3,193 5.95 2,890 5.38 Trade and other receivables 7,022 12.25 5.761 10.74 5.574 10.38 Assets held for sale 70 0.13 982 1.83 Income tax receivable 364 0.64 285 0.53 207 0.39 Investments in associated and joint ventures 39 0.07 58 0.11 89 0.17 Total operating assets 57,316 100.00 53,661 100.00 53,723 100.00 OPAT CE NFE CE 4119.20 2.235 15,638 26.34 975.20 15,638 6.24 20.10 3,074.80 14596.00 14,044 15.31 21.89 1008 1024.8 14596.00 14,044 6.91 7.30 8.41 14.60 ROCE Operating liabilities Trade and other payable Provision Income tax payable Deffered tax liabilies Retirement benefits obligation Provision other payable Total operating laibilities OPAT NOA RNOA 2020.00 4119.20 2,235 26640.00 15.46 2019 2018 3,074.80 25,161 26,260 8.88 11.71 4119.2 26,640 15.46 (15,785) (976) (1,127) (2.918) (3,202) (584) (6,084) (30,676) 3.00 26,640 51.46 3.18 3.67 9.51 10.44 1.90 19.83 100.00 (13,987) 49.08 (723) 2.54 (1,361) 4.78 (2,490) 8.74 (2,807) 9.85 (841) (6,291) 22.07 (28,500) 100.00 2235 ###### 25,161 26,260 8.88 11.71 ( (12,841) 46.76 (506) 1.84 (1,164) 4.24 (3,286) 11.97 (2,511) 9.14 (385) 1.40 (6,770) 24.65 (27,463) 100.00 2.95 NFO CE FLEV 11002.00 15,638 0.70 10565.00 14596.00 0.72 12216 14,044 0.87 4119.2 2235 ###### 26,640 25,161 26,260 15.46 8.88 11.71 Net operating assets 25,161 26,260 RNOA NBC SPREAD 15.46 8.86 6.60 8.88 9.54 -0.66 11.71 8.39 3.32 Financial assets other investmetents Derivatives financial instruments other investmetents Derivatives financial instruments Cash and other Cash equivalents Toal Financial assets 1,10 171 160 142 7,832 9,413 11.77 1.82 1.70 1.51 83.20 100.00 1,401 61 849 36 5,369 7,716 18.16 0.79 11.00 0.47 69.58 100.00 833 157 849 258 4,831 6.928 12.02 2.27 12.25 3.72 69.73 100.00 NBC 8.86 20.10 9.54 8.41 8.39 14.60 (1,754) 9.16 OPM ATO RNOA 15.91 0.97 15.46 Finance laibilities Interest-bearing loans and borrowings Lease liabilities Derivative financial instruments Interest-bearing loans and borrowings Lease liabilities Derivative financial instruments Total Financial laibilities (2,194) (192) (33) (17,505) (489) (2) (20,415) 10.75 0.94 0.16 85.75 2.40 0.01 100.00 (1,822) (188) ) (36) (15,730) (487) (18) (18,281) ) 9.97 1.03 0.20 86.05 2.66 0.10 100.00 (27) 0.14 (17,359) 90.68 (4) (19,144) 0.02 100.00 Net Financial liabilites (11,002) (10,565) Street (12,216) ) Net assets 15,638 14,596 14,044 328 Equity Share capital Share premium account Capital redemption reserve Merger reserve Other reserves Retained earnings 7,971 153 448 1,423 5,299 15,622 16 15,638 328 7,941 153 448 1,445 2,812 13,127 1,469 14,596 317 4,427 153 448 1,440 5,683 12,468 1,576 14,044 Non-Controlling interests Total equity OPAT NOA RNOA 7.170.84 34,877 20.56 GlaxoSmithKline, ending 31st december 2020 Reformulated statement of Financial position 2020 Operating assets Em Property, plant and equipment 10,176 14.36 Right of use assets 830 1.17 Goodwill 10,597 14.96 Other intangible assets 29,824 42.10 Investments in associates and joint ventures 364 0.51 Deferred tax assets 4,287 6.05 Inventories 5,996 8.46 Other non-ourrent assets 1,041 1.47 Current tax recoverable 671 0.95 Trade and other receivanbles 6,952 9.81 Assets held for sales 106 0.15 Total operating assets ##### 100.00 NFO CE FLEV ###### ###### 0.68 RNOA NBC SPREAD ROCE 20.56 5.57 14.99 30.69 NBC 5.57 Operating laibilities Short-term borrowings (3,725) 10.45 Contingent consideration liabilities (5869) 16.47 Trade and other payable (15,840) 44.44 Current tax payable (545) 1.53 Short-term provisions (1,052) 2.95 Corporation tax payable (176) 0.49 Defferred tax liability (3,600) 10.10 Pensions and other post-employment benefits (3,650) 10.24 Other provision (707) 1.98 Other non-current liabilties (803) 2.25 Total operating liability (35,643 100.00 OPM ATO RNOA 21.03 0.98 20.56 Net operating assets 34,877 Financial assets Other investments Derivative financial instruments Liquid investments Cash and oash equivalents Total financial assets 3,060 157 78 6,292 9,587 31.92 1.64 0.81 65.63 100.00 Financial laibility Long-term borrowings Derivative financial instruments Total financial laibility (23,425) 99.02 (231) 0.98 (23,656, 100.00 Net financial laibilities (14,069) Net assets ##### Equity Share capital Share premium account Retained earnings Other reserves Shareholders equity Non-controlling interests Total equity 1,346 3,281 6.755 3,205 14,587 6,221 #####
Step by Step Solution
There are 3 Steps involved in it
Step: 1

Get Instant Access to Expert-Tailored Solutions
See step-by-step solutions with expert insights and AI powered tools for academic success
Step: 2

Step: 3

Ace Your Homework with AI
Get the answers you need in no time with our AI-driven, step-by-step assistance
Get Started


