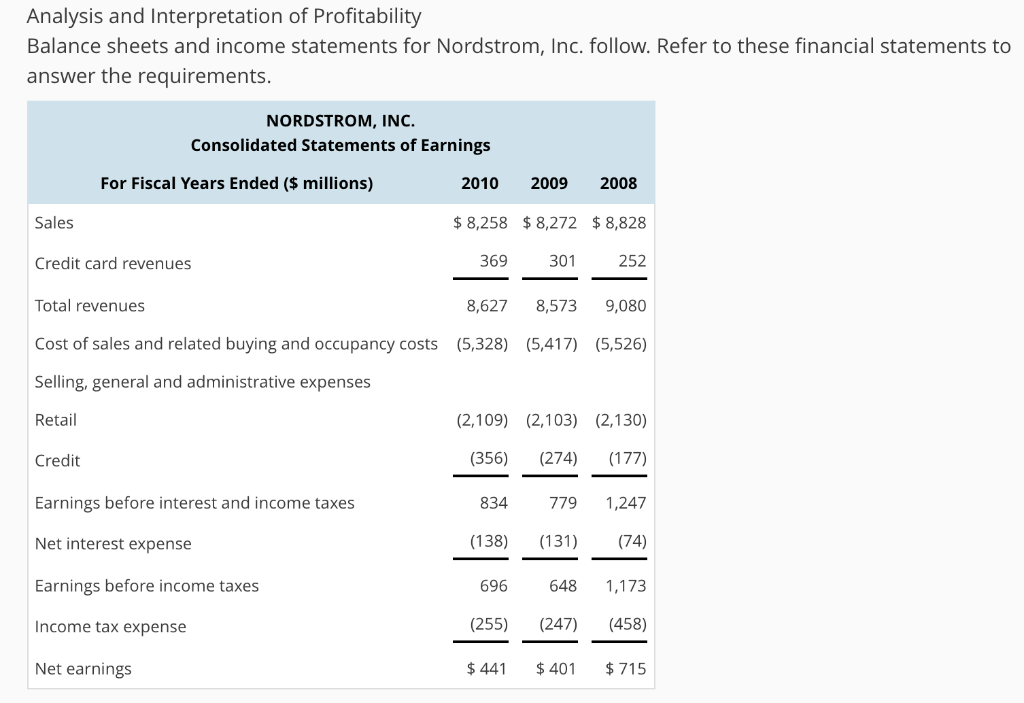
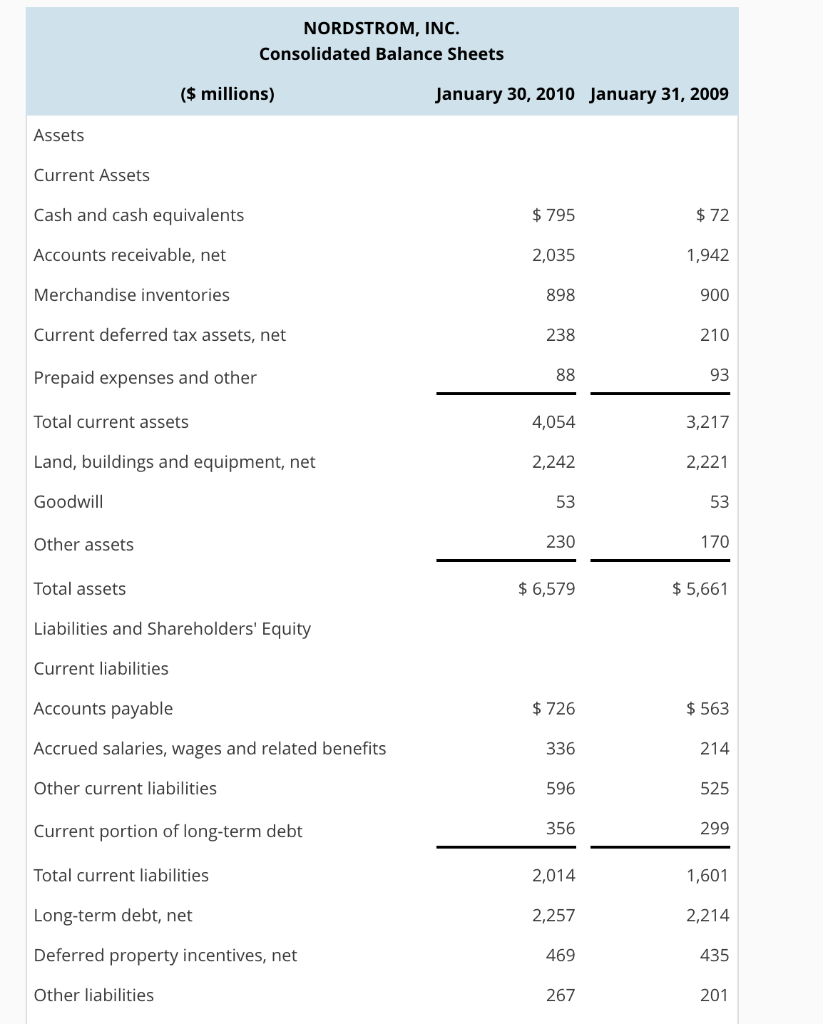
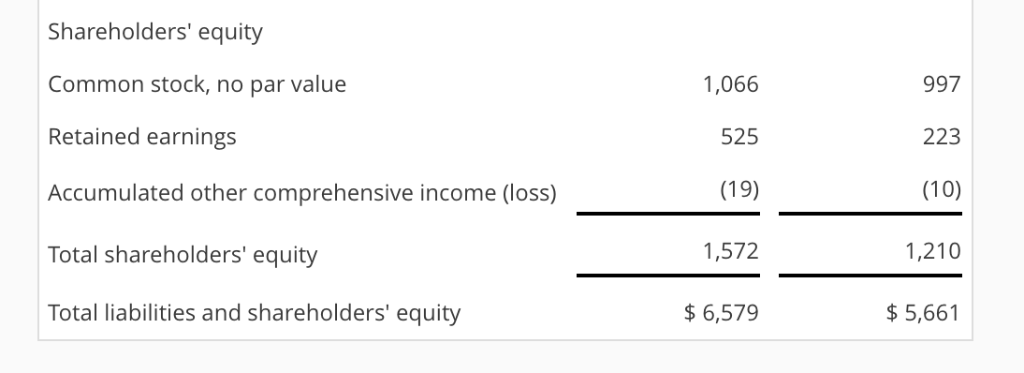
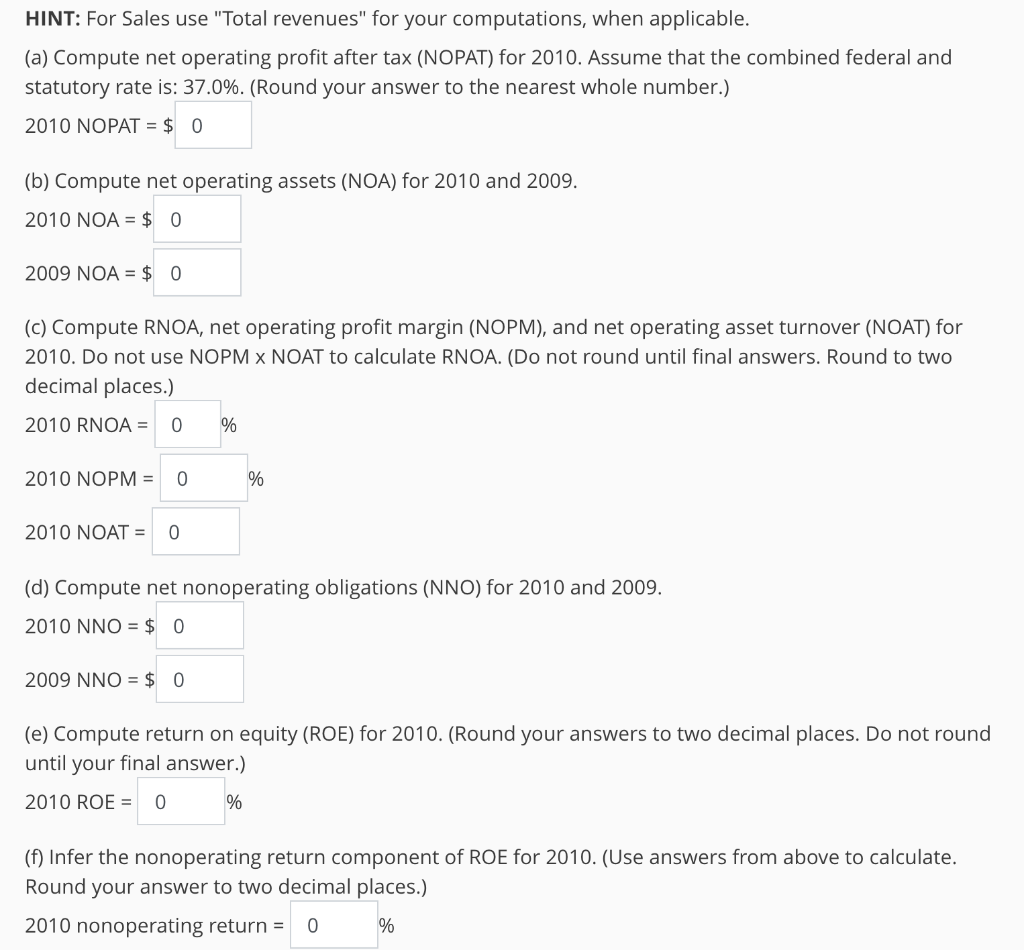
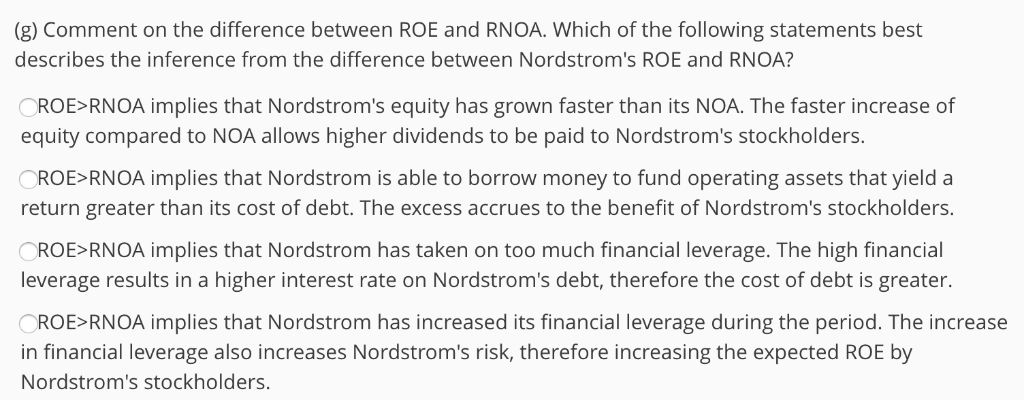
Analysis and Interpretation of Profitability Balance sheets and income statements for Nordstrom, Inc. follow. Refer to these financial statements to answer the requirements NORDSTROM, INC. Consolidated Statements of Earnings For Fiscal Years Ended ( millions) 2010 2009 2008 Sales Credit card revenues Total revenues Cost of sales and related buying and occupancy costs (5,328) 5,417) (5,526) Selling, general and administrative expenses Retail Credit Earnings before interest and income taxes Net interest expense Earnings before income taxes Income tax expense Net earnings $8,258 8,272 $8,828 252 8,627 8,573 9,080 369 301 (2,109) (2,103 (2,130) (356) (274) (177) 779 1,247 (138) (131) (74) 648 1,173 (255) (247) (458) $441 401 $715 834 696 NORDSTROM, INC. Consolidated Balance Sheets $ millions) January 30, 2010 January 31, 2009 Assets Current Assets Cash and cash equivalents Accounts receivable, net Merchandise inventories Current deferred tax assets, net Prepaid expenses and other Total current assets Land, buildings and equipment, net Goodwill Other assets Total assets Liabilities and Shareholders' Equity Current liabilities Accounts payable Accrued salaries, wages and related benefits Other current liabilities Current portion of long-term debt Total current liabilities Long-term debt, net Deferred property incentives, net Other liabilities $795 2,035 898 238 $72 1,942 900 210 93 3,217 2,221 53 170 $5,661 4,054 2,242 53 230 6,579 $726 336 596 356 2,014 2,257 469 267 $563 214 525 299 1,601 2,214 435 201 Shareholders' equity Common stock, no par value Retained earnings Accumulated other comprehensive income (loss) Total shareholders' equity Total liabilities and shareholders' equity 1,066 525 (19) 1,572 6,579 997 223 (10) 1,210 $5,661 HINT: For Sales use "Total revenues" for your computations, when applicable. (a) Compute net operating profit after tax (NOPAT) for 2010. Assume that the combined federal and statutory rate is: 37.0%. (Round your answer to the nearest whole number.) 2010 NOPAT 0 (b) Compute net operating assets (NOA) for 2010 and 2009. 2010 NOA $0 2009 NOA 0 (c) Compute RNOA, net operating profit margin (NOPM), and net operating asset turnover (NOAT) for 2010. Do not use NOPM x NOAT to calculate RNOA. (Do not round until final answers. Round to two decimal places.) 2010RNOA- 0 % 2010 NOPM0% 2010 NOAT-0 (d) Compute net nonoperating obligations (NNO) for 2010 and 2009. 2010 NNO = $ 0 2009 NNO 0 (e) Compute return on equity (ROE) for 2010. (Round your answers to two decimal places. Do not round until your final answer.) 2010 ROE 0% (f) Infer the nonoperating return component of ROE for 2010. (Use answers from above to calculate. Round your answer to two decimal places.) 2010 nonoperating returns 0 % (g) Comment on the difference between ROE and RNOA. Which of the following statements best describes the inference from the difference between Nordstrom's ROE and RNOA? ROE RNOA implies that Nordstrom's equity has grown faster than its NOA. The faster increase of equity compared to NOA allows higher dividends to be paid to Nordstrom's stockholders ROE>RNOA implies that Nordstrom is able to borrow money to fund operating assets that yield a return greater than its cost of debt. The excess accrues to the benefit of Nordstrom's stockholders. ROE-RNOA implies that Nordstrom has taken on too much financial leverage. The high financial leverage results in a higher interest rate on Nordstrom's debt, therefore the cost of debt is greater ROE RNOA implies that Nordstrom has increased its financial leverage during the period. The increase in financial leverage also increases Nordstrom's risk, therefore increasing the expected ROE by Nordstrom's stockholders. Analysis and Interpretation of Profitability Balance sheets and income statements for Nordstrom, Inc. follow. Refer to these financial statements to answer the requirements NORDSTROM, INC. Consolidated Statements of Earnings For Fiscal Years Ended ( millions) 2010 2009 2008 Sales Credit card revenues Total revenues Cost of sales and related buying and occupancy costs (5,328) 5,417) (5,526) Selling, general and administrative expenses Retail Credit Earnings before interest and income taxes Net interest expense Earnings before income taxes Income tax expense Net earnings $8,258 8,272 $8,828 252 8,627 8,573 9,080 369 301 (2,109) (2,103 (2,130) (356) (274) (177) 779 1,247 (138) (131) (74) 648 1,173 (255) (247) (458) $441 401 $715 834 696 NORDSTROM, INC. Consolidated Balance Sheets $ millions) January 30, 2010 January 31, 2009 Assets Current Assets Cash and cash equivalents Accounts receivable, net Merchandise inventories Current deferred tax assets, net Prepaid expenses and other Total current assets Land, buildings and equipment, net Goodwill Other assets Total assets Liabilities and Shareholders' Equity Current liabilities Accounts payable Accrued salaries, wages and related benefits Other current liabilities Current portion of long-term debt Total current liabilities Long-term debt, net Deferred property incentives, net Other liabilities $795 2,035 898 238 $72 1,942 900 210 93 3,217 2,221 53 170 $5,661 4,054 2,242 53 230 6,579 $726 336 596 356 2,014 2,257 469 267 $563 214 525 299 1,601 2,214 435 201 Shareholders' equity Common stock, no par value Retained earnings Accumulated other comprehensive income (loss) Total shareholders' equity Total liabilities and shareholders' equity 1,066 525 (19) 1,572 6,579 997 223 (10) 1,210 $5,661 HINT: For Sales use "Total revenues" for your computations, when applicable. (a) Compute net operating profit after tax (NOPAT) for 2010. Assume that the combined federal and statutory rate is: 37.0%. (Round your answer to the nearest whole number.) 2010 NOPAT 0 (b) Compute net operating assets (NOA) for 2010 and 2009. 2010 NOA $0 2009 NOA 0 (c) Compute RNOA, net operating profit margin (NOPM), and net operating asset turnover (NOAT) for 2010. Do not use NOPM x NOAT to calculate RNOA. (Do not round until final answers. Round to two decimal places.) 2010RNOA- 0 % 2010 NOPM0% 2010 NOAT-0 (d) Compute net nonoperating obligations (NNO) for 2010 and 2009. 2010 NNO = $ 0 2009 NNO 0 (e) Compute return on equity (ROE) for 2010. (Round your answers to two decimal places. Do not round until your final answer.) 2010 ROE 0% (f) Infer the nonoperating return component of ROE for 2010. (Use answers from above to calculate. Round your answer to two decimal places.) 2010 nonoperating returns 0 % (g) Comment on the difference between ROE and RNOA. Which of the following statements best describes the inference from the difference between Nordstrom's ROE and RNOA? ROE RNOA implies that Nordstrom's equity has grown faster than its NOA. The faster increase of equity compared to NOA allows higher dividends to be paid to Nordstrom's stockholders ROE>RNOA implies that Nordstrom is able to borrow money to fund operating assets that yield a return greater than its cost of debt. The excess accrues to the benefit of Nordstrom's stockholders. ROE-RNOA implies that Nordstrom has taken on too much financial leverage. The high financial leverage results in a higher interest rate on Nordstrom's debt, therefore the cost of debt is greater ROE RNOA implies that Nordstrom has increased its financial leverage during the period. The increase in financial leverage also increases Nordstrom's risk, therefore increasing the expected ROE by Nordstrom's stockholders


