Analysis for boeing's annual lrogram production units/deferred production balances disclosed
(2000-2016)
i hope its clear now, you can find it online
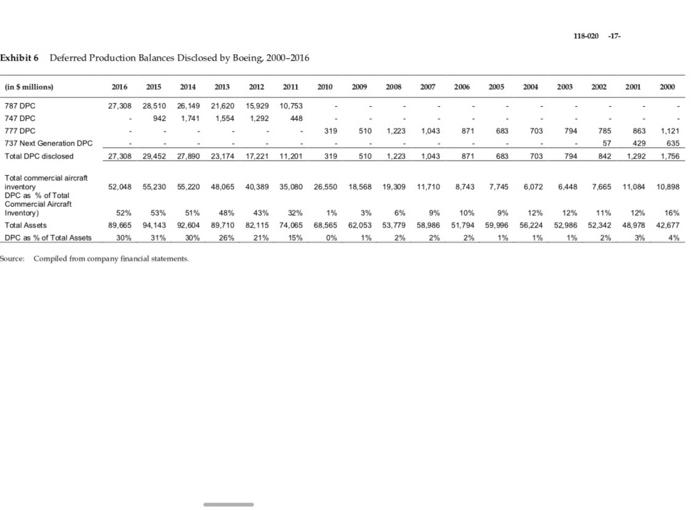
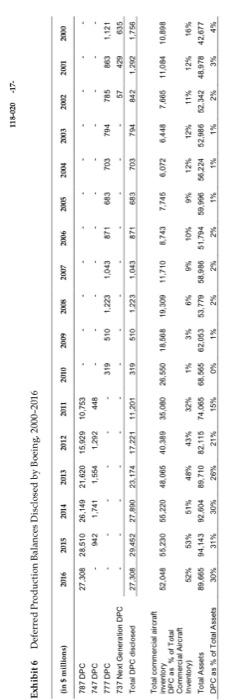
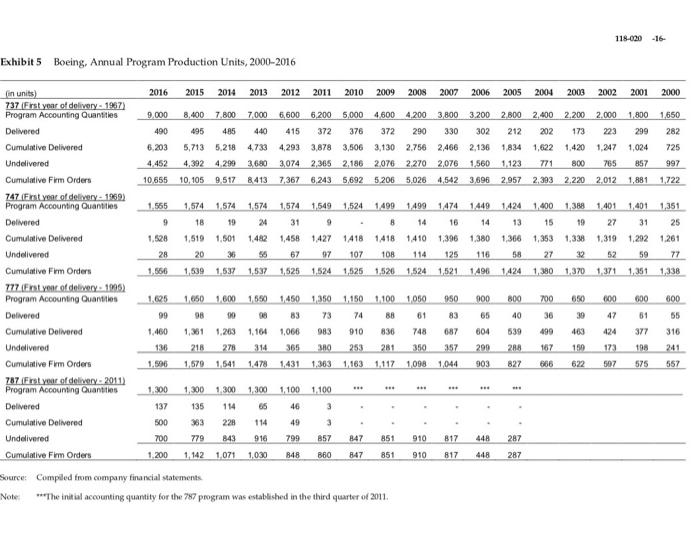
118-020-16- Exhibit 5 Boeing, Annual Program Production Units, 2000-2016 114 in units) 2016 2015 2014 2013 2012 2011 2010 2009 2008 2007 2006 2005 2004 2003 2002 2001 2000 737 (First year of delivery - 1967) Program Accounting Quantities 9.000 8,400 7800 7.000 6,600 6.200 5,000 4600 4.200 3,800 3.200 2,800 2,400 2,200 2,000 1,800 1,650 Delivered 490 495 485 440 415 372 376 372 290 330 302 212 202 173 223 299 282 Cumulative Delivered 6,203 5,713 5.218 4.733 4,293 3,878 3,506 3,130 2.756 2.466 2,136 1,834 1,622 1.420 1,247 1,024 725 Undelivered 4.452 4,392 4.299 3.680 3,074 2,365 2,186 2,076 2.270 2,076 1,560 1.123 771 800 765 857 997 Cumulative Firm Orders 10655 10,105 9,517 8413 7.367 6,243 5,6925206 5.026 4,542 3,696 2957 2,393 2.220 2.012 1,881 1,722 747 (Erst year of delivery - 1969) Program Accounting Quantities 1.555 1.574 1.574 1.574 1574 1,549 1,524 1499 1499 1474 1449 1.424 1.400 1.3 1,401 1,401 1.351 Delivered 9 18 19 24 31 9 8 14 16 14 13 15 19 27 31 25 Cumulative Delivered 1,528 1,519 1.501 1.482 1,458 1.427 1418 1418 1,410 1,396 1.380 1,366 1,353 1,338 1,319 1,292 1.261 Undelivered 28 20 36 67 97 107 108 125 116 58 27 32 52 59 77 Cumulative Firm Orders 1.566 1,539 1.537 1.537 1,525 1,524 1,525 1520 1,524 1,521 1496 1424 1,380 1.370 1371 1.351 1.338 777 (Erster of delivery - 1905) Program Accounting Quantities 1.625 1.650 1600 1650 1,450 1,350 1,150 1.100 1050 950 900 800 700 650 000 600 Delivered 99 98 90 83 73 74 88 61 83 65 40 36 39 47 51 55 Cumulative Delivered 1,460 1.263 1,164 1,066 983 910 836 748 687 604 539 499 463 424 377 316 Undelivered 136 218 278 314 365 380 253 281 357 290 288 167 150 173 198 241 Cumulative Firm Orders 1.596 1,579 1,541 1.478 1431 1.363 1,163 1.117 1,098 1,044 903 827 666 622 507 575 557 787 First year of delivery - 2011) Program Accounting Quantities 1,300 1.300 1300 1100 1.100 Delivered 137 65 46 3 Cumulative Delivered 500 363 228 114 49 3 Undelivered 700 779 843 916 799 857 847 851 910 817 448 287 Cumulative Firm Orders 1.200 1,142 1071 1.030 B48 B60 847 851 910 817 448 287 Source: Compiled from company financial statements **The initial accounting quantity for the 787 program was established in the third quarter of 2011, 600 135 114 116-020 -17- Exhibit 6 Deferred Production Balances Disclosed by Boeing, 2000-2016 2011 2010 2009 2008 2007 2006 2005 2004 2003 2002 2001 2000 fin 5 millions 787 DPC 747 DPC 777 DPC 737 Next Generation DPC Total DPC disclosed 2016 2015 2014 2013 2012 27,308 28,510 26,149 21620 15,929 942 1.741 1,554 1.292 10.753 319 510 1.223 1,043 871 683 703 794 785 57 B42 863 429 1 292 1.121 6:35 27308 29.452 27.890 23.174 17.221 11,201 319 1.223 703 794 52,048 55230 55.220 48,065 40,389 35,080 26.550 18,568 19.309 11.710 8.743 7.745 6,072 6.448 7,665 11.084 10.898 Total commercial aircraft Inventory DPC as of Total Commercial Aircraft Inventory) Total Assets DPC as % of Total Assets 43% 52% 53% 51% 89,665 94.143 92,604 30% 31% 30% 48% 89,710 265 12.115 21% 74.065 15% 1% 3% 6% 9% 10% 9% 68,565 62053 53,779 58,986 51,794 59.996 0's 29 2% 2% 1% 12% 56.224 1% 12% 52.986 15 11% 12% 16% 52,342 48 978 42.677 2% 3 4% Source: Compiled from company financial statements 2016 2015 2014 2013 2012 2011 2010 2009 2008 2007 2006 2005 2004 2003 2002 2001 2000 9,000 490 6.203 8.400 7800 7000 6600 6.200 5000 4600 4 200 3800 3200 2800 2.400 2200 2000 1.800 1650 485 440 415 372 376 372 330 302 212 202 173 299 282 5,713 5.218 4.733 4293 3.878 3.506 3.130 2.756 2466 2.136 1.834 1.622 1420 1,247 1,024 725 4.352 4 299 3.680 2074 2.365 2106 2076 2270 2076 1560 1123 771 800 765 997 10.1069,517 8.413 736762435.6925205 5.026 45423.696 2.957 2.393 2220 2012 1 881 1.722 10.655 1555 1.424 1.400 1,388 1.401 1,401 1.351 9 13 15 19 27 31 1.528 1 574 1574 1574 1574 1549 1524 1499 1.499 1474 1449 18 19 24 31 8 14 16 14 1.519 1.501 1 482 1458 1427 148 1418 1.410 1.396 1.380 20 36 55 67 97 107 108 114 125 116 1.539 1537 1,537 1525 1524 1525 1526 1,524 1.521 1496 1.366 1.292 1.319 52 25 1.261 77 28 58 27 32 in units 737 (Erste delivery. 1967) Program Accounting Quantities Delvered Cumulative Delivered Undelivered Cumulative Firm Orders 747 Erst year oldelivery. 1909) Program Accounting Quantities Delivered Cumulative Delivered Undelivered Cumulative Firm Orders 777 (Erst year of delivery - 1996) Program Accounting Quantities Delvered Cumulative Delivered Undelivered Cumulative Firm Orders 787 (Erste delivery. 2011) Program Accounting Quantities Delvered Cumulative Delivered Undelivered Cumulative Firm Orders 59 14241380 1370 1371 1,351 1.338 1.025 300 800 700 650 600 600 600 99 65 40 47 61 55 1650 1600 1550 1450 1350 1150 1.100 1.050 950 98 90 98 83 73 74 88 61 83 1.361 1.263 1.164 1066 903 910 836 748 218 278 314 365 380 250 281 357 1579 1541 1478 1431 1363 11631.117 1098 1044 36 499 604 463 424 377 1.450 136 1506 316 288 167 159 173 198 241 503 827 666 622 597 575 557 1.300 i ... 500 100 1 200 1300 1300 1300 1.100 1.100 135 114 65 463 303 228 114 770 843 016 199 857 1.142 1071 1.000 848 MO 847 851 910 817 448 287 847 851 910 017 40 118-020 -17- Exhibit 6 Deferred Production Balances Disclosed by Boeing, 2000-2016 in millions 2016 2010 2009 2005 2017 2006 2004 2013 2002 2001 2000 2015 2013 2011 27.308 28.510 26,149 21.620 15,929 10,753 942 1,741 1,554 1.292 448 787 DPC 747 DPC 777 OPC 737 Next Generation DPC Total DPC disclosed 319 510 1.223 1,043 871 683 703 794 1.121 785 57 142 27 28 29 45227.800 23.174 17221 11,201 319 510 1223 1,043 87 583 703 794 1,292 1,756 52.0455230 56.220 48,065 40.380 35,060 26,550 18,568 19,309 11.710 8743 7.745 6,072 0448 7,665 11064 10,898 Total commercial aircraft vertory OPCO of Total Commercial Aircraft Inventory) Total Assets OPC as % of Total Assets 52% 53% 89.665 94.143 30% 31% 61% 48% 92.004 89.710 30% 26% 32% 1% 3% 6% 82.115 74,065 68,565 62.063 53.779 58,986 21% 15% 1% 2% 10% 51.794 2% 124 12% 56.224 52,986 52.342 1% 1% 2% 12% 16% 48.978 42.677 50.996 1% 118-020-16- Exhibit 5 Boeing, Annual Program Production Units, 2000-2016 114 in units) 2016 2015 2014 2013 2012 2011 2010 2009 2008 2007 2006 2005 2004 2003 2002 2001 2000 737 (First year of delivery - 1967) Program Accounting Quantities 9.000 8,400 7800 7.000 6,600 6.200 5,000 4600 4.200 3,800 3.200 2,800 2,400 2,200 2,000 1,800 1,650 Delivered 490 495 485 440 415 372 376 372 290 330 302 212 202 173 223 299 282 Cumulative Delivered 6,203 5,713 5.218 4.733 4,293 3,878 3,506 3,130 2.756 2.466 2,136 1,834 1,622 1.420 1,247 1,024 725 Undelivered 4.452 4,392 4.299 3.680 3,074 2,365 2,186 2,076 2.270 2,076 1,560 1.123 771 800 765 857 997 Cumulative Firm Orders 10655 10,105 9,517 8413 7.367 6,243 5,6925206 5.026 4,542 3,696 2957 2,393 2.220 2.012 1,881 1,722 747 (Erst year of delivery - 1969) Program Accounting Quantities 1.555 1.574 1.574 1.574 1574 1,549 1,524 1499 1499 1474 1449 1.424 1.400 1.3 1,401 1,401 1.351 Delivered 9 18 19 24 31 9 8 14 16 14 13 15 19 27 31 25 Cumulative Delivered 1,528 1,519 1.501 1.482 1,458 1.427 1418 1418 1,410 1,396 1.380 1,366 1,353 1,338 1,319 1,292 1.261 Undelivered 28 20 36 67 97 107 108 125 116 58 27 32 52 59 77 Cumulative Firm Orders 1.566 1,539 1.537 1.537 1,525 1,524 1,525 1520 1,524 1,521 1496 1424 1,380 1.370 1371 1.351 1.338 777 (Erster of delivery - 1905) Program Accounting Quantities 1.625 1.650 1600 1650 1,450 1,350 1,150 1.100 1050 950 900 800 700 650 000 600 Delivered 99 98 90 83 73 74 88 61 83 65 40 36 39 47 51 55 Cumulative Delivered 1,460 1.263 1,164 1,066 983 910 836 748 687 604 539 499 463 424 377 316 Undelivered 136 218 278 314 365 380 253 281 357 290 288 167 150 173 198 241 Cumulative Firm Orders 1.596 1,579 1,541 1.478 1431 1.363 1,163 1.117 1,098 1,044 903 827 666 622 507 575 557 787 First year of delivery - 2011) Program Accounting Quantities 1,300 1.300 1300 1100 1.100 Delivered 137 65 46 3 Cumulative Delivered 500 363 228 114 49 3 Undelivered 700 779 843 916 799 857 847 851 910 817 448 287 Cumulative Firm Orders 1.200 1,142 1071 1.030 B48 B60 847 851 910 817 448 287 Source: Compiled from company financial statements **The initial accounting quantity for the 787 program was established in the third quarter of 2011, 600 135 114 116-020 -17- Exhibit 6 Deferred Production Balances Disclosed by Boeing, 2000-2016 2011 2010 2009 2008 2007 2006 2005 2004 2003 2002 2001 2000 fin 5 millions 787 DPC 747 DPC 777 DPC 737 Next Generation DPC Total DPC disclosed 2016 2015 2014 2013 2012 27,308 28,510 26,149 21620 15,929 942 1.741 1,554 1.292 10.753 319 510 1.223 1,043 871 683 703 794 785 57 B42 863 429 1 292 1.121 6:35 27308 29.452 27.890 23.174 17.221 11,201 319 1.223 703 794 52,048 55230 55.220 48,065 40,389 35,080 26.550 18,568 19.309 11.710 8.743 7.745 6,072 6.448 7,665 11.084 10.898 Total commercial aircraft Inventory DPC as of Total Commercial Aircraft Inventory) Total Assets DPC as % of Total Assets 43% 52% 53% 51% 89,665 94.143 92,604 30% 31% 30% 48% 89,710 265 12.115 21% 74.065 15% 1% 3% 6% 9% 10% 9% 68,565 62053 53,779 58,986 51,794 59.996 0's 29 2% 2% 1% 12% 56.224 1% 12% 52.986 15 11% 12% 16% 52,342 48 978 42.677 2% 3 4% Source: Compiled from company financial statements 2016 2015 2014 2013 2012 2011 2010 2009 2008 2007 2006 2005 2004 2003 2002 2001 2000 9,000 490 6.203 8.400 7800 7000 6600 6.200 5000 4600 4 200 3800 3200 2800 2.400 2200 2000 1.800 1650 485 440 415 372 376 372 330 302 212 202 173 299 282 5,713 5.218 4.733 4293 3.878 3.506 3.130 2.756 2466 2.136 1.834 1.622 1420 1,247 1,024 725 4.352 4 299 3.680 2074 2.365 2106 2076 2270 2076 1560 1123 771 800 765 997 10.1069,517 8.413 736762435.6925205 5.026 45423.696 2.957 2.393 2220 2012 1 881 1.722 10.655 1555 1.424 1.400 1,388 1.401 1,401 1.351 9 13 15 19 27 31 1.528 1 574 1574 1574 1574 1549 1524 1499 1.499 1474 1449 18 19 24 31 8 14 16 14 1.519 1.501 1 482 1458 1427 148 1418 1.410 1.396 1.380 20 36 55 67 97 107 108 114 125 116 1.539 1537 1,537 1525 1524 1525 1526 1,524 1.521 1496 1.366 1.292 1.319 52 25 1.261 77 28 58 27 32 in units 737 (Erste delivery. 1967) Program Accounting Quantities Delvered Cumulative Delivered Undelivered Cumulative Firm Orders 747 Erst year oldelivery. 1909) Program Accounting Quantities Delivered Cumulative Delivered Undelivered Cumulative Firm Orders 777 (Erst year of delivery - 1996) Program Accounting Quantities Delvered Cumulative Delivered Undelivered Cumulative Firm Orders 787 (Erste delivery. 2011) Program Accounting Quantities Delvered Cumulative Delivered Undelivered Cumulative Firm Orders 59 14241380 1370 1371 1,351 1.338 1.025 300 800 700 650 600 600 600 99 65 40 47 61 55 1650 1600 1550 1450 1350 1150 1.100 1.050 950 98 90 98 83 73 74 88 61 83 1.361 1.263 1.164 1066 903 910 836 748 218 278 314 365 380 250 281 357 1579 1541 1478 1431 1363 11631.117 1098 1044 36 499 604 463 424 377 1.450 136 1506 316 288 167 159 173 198 241 503 827 666 622 597 575 557 1.300 i ... 500 100 1 200 1300 1300 1300 1.100 1.100 135 114 65 463 303 228 114 770 843 016 199 857 1.142 1071 1.000 848 MO 847 851 910 817 448 287 847 851 910 017 40 118-020 -17- Exhibit 6 Deferred Production Balances Disclosed by Boeing, 2000-2016 in millions 2016 2010 2009 2005 2017 2006 2004 2013 2002 2001 2000 2015 2013 2011 27.308 28.510 26,149 21.620 15,929 10,753 942 1,741 1,554 1.292 448 787 DPC 747 DPC 777 OPC 737 Next Generation DPC Total DPC disclosed 319 510 1.223 1,043 871 683 703 794 1.121 785 57 142 27 28 29 45227.800 23.174 17221 11,201 319 510 1223 1,043 87 583 703 794 1,292 1,756 52.0455230 56.220 48,065 40.380 35,060 26,550 18,568 19,309 11.710 8743 7.745 6,072 0448 7,665 11064 10,898 Total commercial aircraft vertory OPCO of Total Commercial Aircraft Inventory) Total Assets OPC as % of Total Assets 52% 53% 89.665 94.143 30% 31% 61% 48% 92.004 89.710 30% 26% 32% 1% 3% 6% 82.115 74,065 68,565 62.063 53.779 58,986 21% 15% 1% 2% 10% 51.794 2% 124 12% 56.224 52,986 52.342 1% 1% 2% 12% 16% 48.978 42.677 50.996 1%