Question
Provide common-size analysis of your companys income statement and balance sheet for the 2 most recent years (must be done using Excel with formulas). Provide
Provide common-size analysis of your company’s income statement and balance sheet for the 2 most recent years (must be done using Excel with formulas).
Provide horizontal analysis of your company’s income statement and balance sheet, showing the dollar amount and percent of change using the 2 most recent years (you must use an Excel spreadsheet with formulas).
http://files.shareholder.com/downloads/ABEA-48ZAJ9/4985684436x0x934637/C9BD5EDF-7322-42E6-8E38-DC51D20BEFF2/Herbalife_Ltd_2016_Annual_Report.pdf
http://files.shareholder.com/downloads/ABEA-48ZAJ9/4985684436x0x882574/93BF84C9-495D-4D9A-A06A-3C20F9294252/Herbalife_Ltd_2015_Annual_Report.pdf
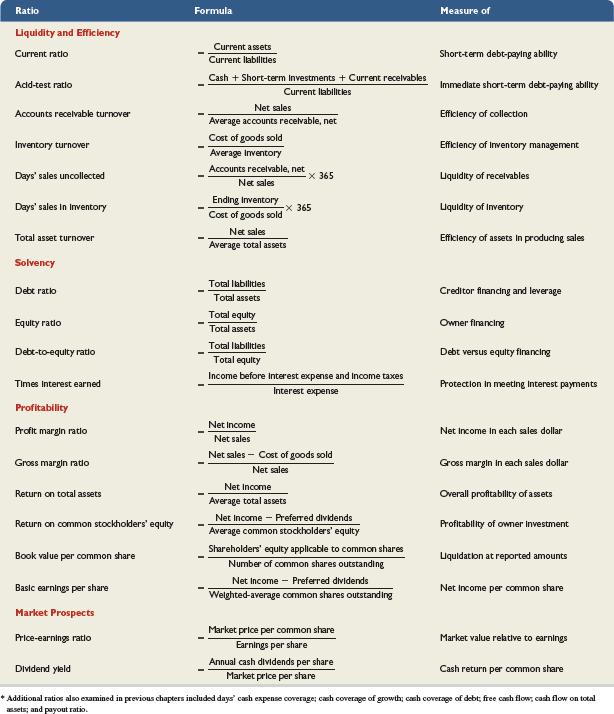
Perform ratio analysis on your company using the ratios listed in Exhibit 13.16 on page 529 of your text (SHOWN BELOW) (these must be in an Excel spreadsheet, using formulas to calculate the ratios). You should present them in a similar format as the text: group by category, list name of ratio, formula in words, and the ratio calculation. Give a short explanation of your conclusions about your company after each category of ratios (i.e. How liquid is your company? How efficiently is it using its assets? etc.).

Ratio Formula Measure of Liquidity and Efficiency Current assets Current ratio Short-term debt-paying ability Current labilitles Cash + Short-term Investments + Current recelvables Immedlate short-term debc-paytng ability Acid-test ratlo Current Ilabilitles Net sales Accounts recelvable turnover Efficiency of collection Average accounts recelvable, net Cost of goods sold Inventory turnover Efficiency of Inventory management Average Inventory Accounts recelvable, net X 365 Days' sales uncollected LUquidity of recelvables Net sales Ending Inventory Days' sales in Inventory x 365 Liquidity of Inventory Cost of goods sold Net sales Total asset turnover Efficiency of assets In producing sales Average total assets Solvency Total Ilabilities Debc ratio Creditor financing and leverage Total assets Total equity Total assets Equity ratio Owner financing Total Ilabilitles Debt-to-equity ratio Debt versus equity financing Total equity Income before interest expense and Income taxes Times Interest earned Protection In meeting Interest payments Interest expense Profitability Net Income Profit margin ratio Net Income In each sales dollar Net sales Net sales - Cost of goods sold Gross margin rato Gross margin in each sales dollar Net sales Net Income Return on total assets Overall profitability of assets Average total assets Net Income - Preferred dividends Return on common stockholders' equity Profitability of owner Investment Average common stockholders' equity Shareholders' equity applicable to common shares Book value per common share Liquidation at reported amounts Number of common shares outstanding Net Income - Preferred dividends Basic earnings per share Net Income per common share Welghted-average common shares outstanding Market Prospects Market price per common share Price-earnings ratio Market value reative to earnings Earnings per share Annual cash dividends per share Dividend yleld Cash return per common share Market price per share * Additional ratios also examined in previous chapters included days' cash expense coverage; cash coverage of growth; cash coverage of debt; free cash flow, cash flow on total assets; and payout ratio.
Step by Step Solution
3.41 Rating (157 Votes )
There are 3 Steps involved in it
Step: 1
Formula used 1 Dollar change Amount in Sept 2015 Amount in Sept 2014 2 Percentage change Dollar Change Amount in Sept 2014 A Income Statement YEAR END...
Get Instant Access to Expert-Tailored Solutions
See step-by-step solutions with expert insights and AI powered tools for academic success
Step: 2

Step: 3

Document Format ( 2 attachments)
63686d3320fa8_231090.pdf
180 KBs PDF File
63686d3320fa8_231090.docx
120 KBs Word File
Ace Your Homework with AI
Get the answers you need in no time with our AI-driven, step-by-step assistance
Get Started


