Answered step by step
Verified Expert Solution
Question
1 Approved Answer
Analyze past returns. You have collected historical data on the annual returns earned over the past 10 years (data range from year -10 to year
Analyze past returns.
You have collected historical data on the annual returns earned over the past 10 years (data range from year -10 to year -1) for the stock market as a whole
- A and B stocks.
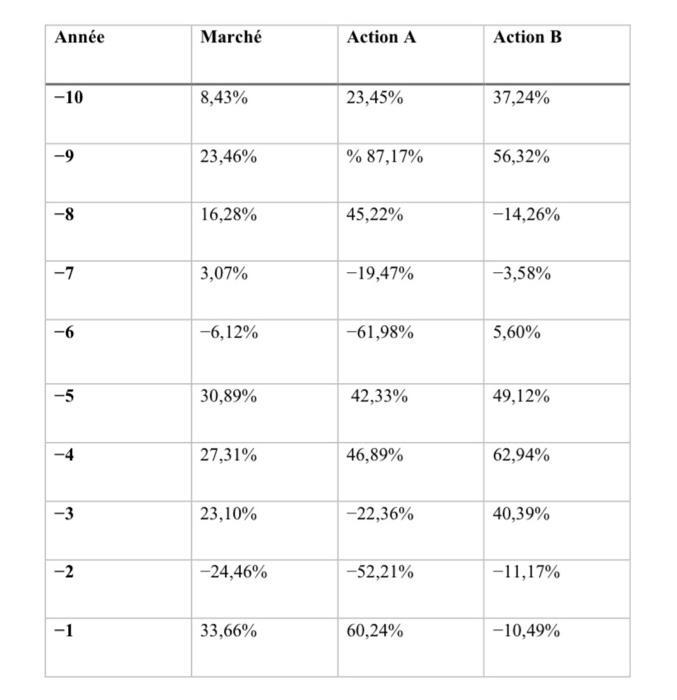
This data is shown in the following table.

- Calculate the means and standard deviations of the realized returns
- Calculate the correlation coefficients between each pair of variables (A,M), (B, M), (A,B).
- Calculate the covariances between each of the pairs of variables (A,M), (B, M), (A, B).
- Determine the beta coefficients of each of the stocks
Anne -10 a -8 -7 -6 -5 T -3 -2 -1 March 8,43% 23,46% 16,28% 3,07% -6,12% 30,89% 27,31% 23,10% -24,46% 33,66% Action A 23,45% % 87,17% 45,22% -19,47% -61,98% 42,33% 46,89% -22,36% -52,21% 60,24% Action B 37,24% 56,32% -14,26% -3,58% 5,60% 49,12% 62,94% 40,39% -11,17% -10,49%
Step by Step Solution
★★★★★
3.35 Rating (142 Votes )
There are 3 Steps involved in it
Step: 1
To calculate the means and standard deviations of the realized returns correlation coefficients cova...
Get Instant Access to Expert-Tailored Solutions
See step-by-step solutions with expert insights and AI powered tools for academic success
Step: 2

Step: 3

Ace Your Homework with AI
Get the answers you need in no time with our AI-driven, step-by-step assistance
Get Started


