Question
Analyze the financial statements of the PTCL Company. (2019/2020 whichever is available). To be specific, you are advised to analyze (compute and interpret) the following


Analyze the financial statements of the PTCL Company. (2019/2020 whichever is available).
To be specific, you are advised to analyze (compute and interpret) the following ratios and techniques:
1. Liquidity Ratios
2. Solvency Ratios
3. Profitability Ratios
4. Efficiency Ratios
5. Coverage Ratios
6. Market Perspect Ratios
7. Trend Analysis
8. Common Size Analysis
9. Du-Pont Analysis
10. Overall analysis of the company based on different ratios and techniques.
Overall points for this assignment are 20 marks (2 each part). Please make sure to interpret each and every ratio you have computed and every technique you have analyzed. The overall scores are sensitive to the interpretation of your results.
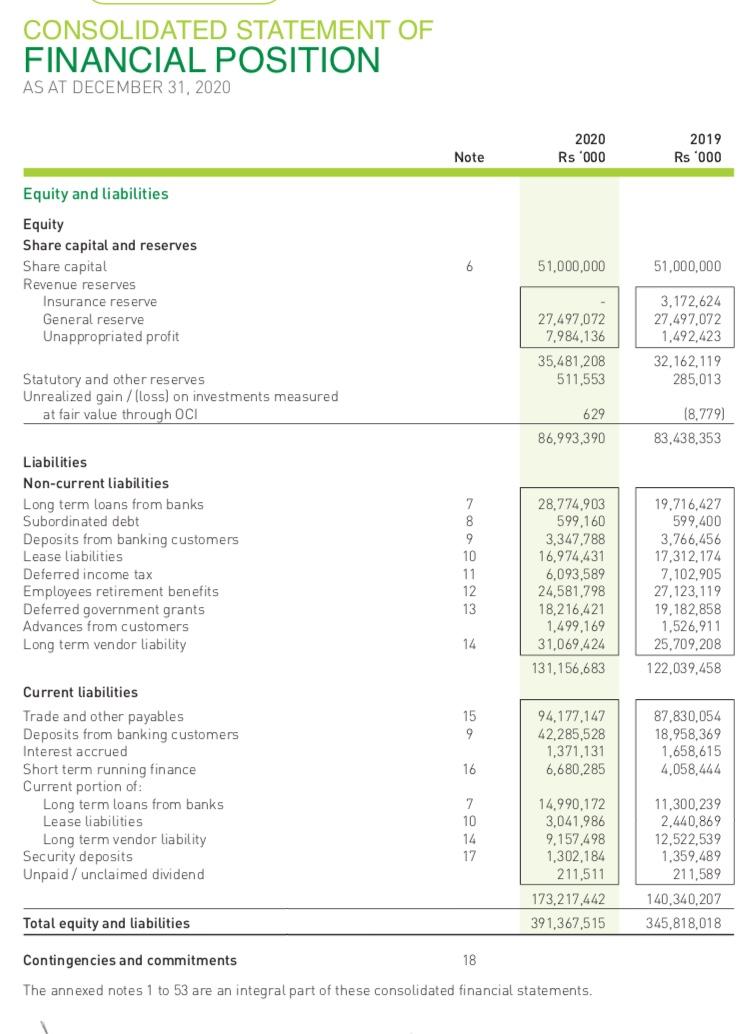
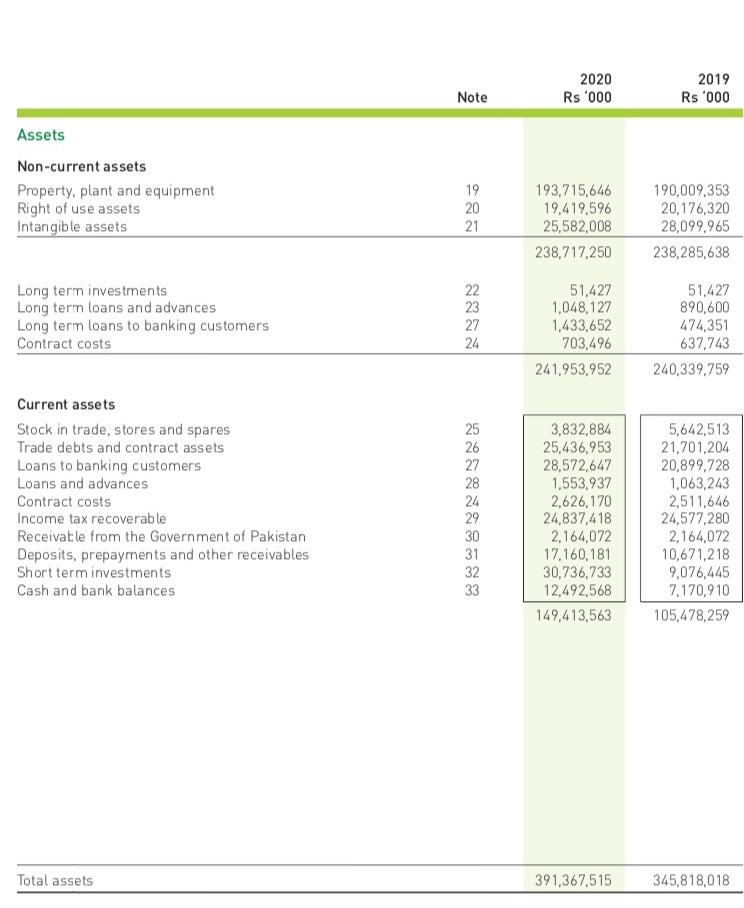
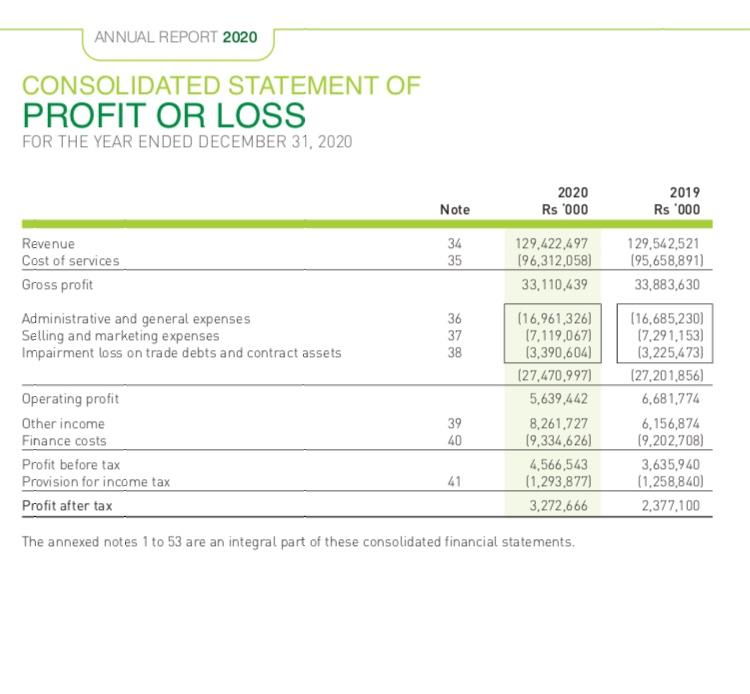
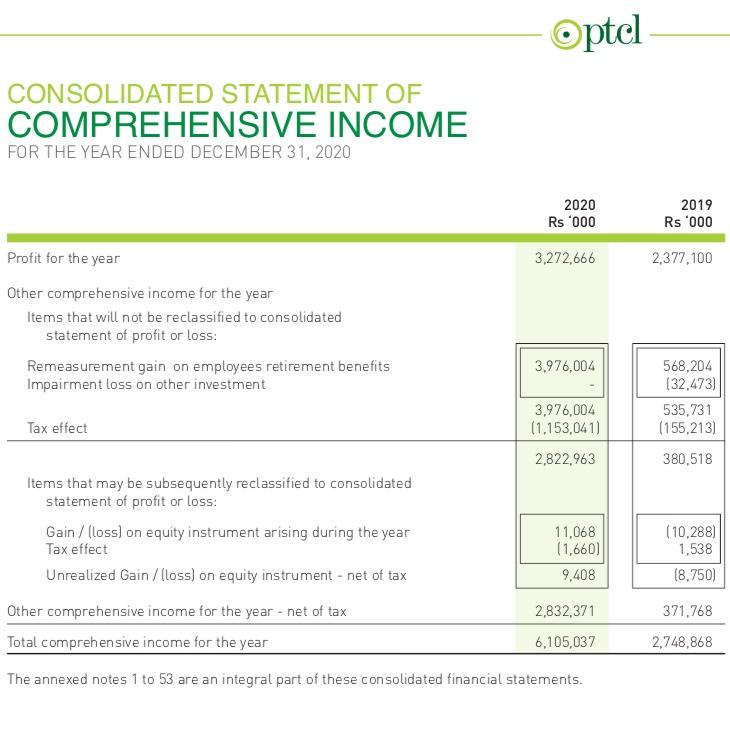
CONSOLIDATED STATEMENT OF FINANCIAL POSITION AS AT DECEMBER 31, 2020 2020 Rs '000 2019 Rs '000 Note Equity and liabilities Equity Share capital and reserves Share capital Revenue reserves Insurance reserve General reserve Unappropriated profit 6 51,000,000 51,000,000 27.497,072 7.984.136 35,481,208 511,553 3,172,624 27,497,072 1,492,423 32,162,119 285,013 Statutory and other reserves Unrealized gain/loss) on investments measured at fair value through OCI 629 86,993,390 (8,779) 83,438.353 Liabilities Non-current liabilities Long term loans from banks Subordinated debt Deposits from banking customers Lease liabilities Deferred income tax Employees retirement benefits Deferred government grants Advances from customers Long term vendor liability 7 8 9 10 11 12 13 28.774.903 599,160 3,347.788 16.974,431 6,093,589 24,581,798 18,216,421 1,499,169 31,069,424 131.156,683 19.716,427 599,400 3,766,456 17,312,174 7.102.905 27,123,119 19.182,858 1,526,911 25,709,208 122,039,458 14 15 94,177,147 42,285,528 1,371,131 6,680,285 87,830,054 18,958,369 1,658,615 4,058,444 16 Current liabilities Trade and other payables Deposits from banking customers Interest accrued Short term running finance Current portion of: Long term loans from banks Lease liabilities Long term vendor liability Security deposits Unpaid / claimed dividend 7 10 14 17 14.990172 3,041.986 9.157.498 1,302,184 211,511 173,217,442 391,367,515 11,300,239 2,440,869 12,522,539 1.359,489 1,589 140,340.207 345,818,018 Total equity and liabilities Contingencies and commitments 18 The annexed notes 1 to 53 are an integral part of these consolidated financial statements. Note 2020 Rs '000 2019 Rs '000 Assets Non-current assets Property, plant and equipment Right of use assets Intangible assets 19 20 21 193,715,646 19,419,596 25,582,008 238,717,250 190,009.353 20,176,320 28,099,965 238,285,638 Long term investments Long term loans and advances Long term loans to banking customers Contract costs 22 23 27 24 51,427 1,048,127 1,433,652 703,496 241,953,952 51,427 890,600 474,351 637,743 240,339.759 Current assets Stock in trade, stores and spares Trade debts and contract assets Loans to banking customers Loans and advances Contract costs Income tax recoverable Receivable from the Government of Pakistan Deposits, prepayments and other receivables Short term investments Cash and bank balances 25 26 27 28 24 29 30 31 32 33 3,832,884 25,436,953 28,572,647 1,553,937 2,626,170 24,837,418 2,164,072 17,160,181 30.736,733 12,492,568 149,413,563 5,642,513 21,701,204 20,899.728 1,063,243 2.511.646 24,577,280 2,164,072 10,671,218 9,076,445 7.170.910 105,478,259 Total assets 391,367,515 345,818,018 ANNUAL REPORT 2020 CONSOLIDATED STATEMENT OF PROFIT OR LOSS FOR THE YEAR ENDED DECEMBER 31, 2020 2020 Rs 000 2019 Rs '000 Note 129,542,521 (95,658,891) 33,883,630 Revenue 34 129,422,497 Cost of services 35 (96,312,058) Gross profit 33,110,439 Administrative and general expenses 36 (16,961,326) Selling and marketing expenses 37 17.119,067) Impairment loss on trade debts and contract assets 38 (3,390,604) (27,470,997) Operating profit 5,639,442 Other income 39 8,261.727 Finance costs 40 19,334,626) Profit before tax 4,566,543 Provision for income tax 41 (1.293,877) Profit after tax 3,272,666 The annexed notes 1 to 53 are an integral part of these consolidated financial statements. (16,685,230) (7.291,153) (3,225,473) (27,201.856) 6,681,774 6,156,874 19,202,708) 3,635,940 (1.258,840) 2.377,100 optel CONSOLIDATED STATEMENT OF COMPREHENSIVE INCOME FOR THE YEAR ENDED DECEMBER 31, 2020 2020 Rs '000 2019 Rs '000 Profit for the year 3,272,666 2,377.100 Other comprehensive income for the year Items that will not be reclassified to consolidated statement of profit or loss: Remeasurement gain on employees retirement benefits Impairment loss on other investment 3,976,004 568,204 (32,473) 535,731 (155,213) Tax effect 3,976,004 (1.153,041) 2,822,963 380,518 Items that may be subsequently reclassified to consolidated statement of profit or loss: Gain / (Loss) on equity instrument arising during the year Tax effect Unrealized Gain /loss) on equity instrument - net of tax Other comprehensive income for the year - net of tax Total comprehensive income for the year 11,068 (1,660) 9,408 (10,288) 1,538 (8.750) 2,832,371 371,768 6,105,037 2,748,868 The annexed notes 1 to 53 are an integral part of these consolidated financial statements. CONSOLIDATED STATEMENT OF FINANCIAL POSITION AS AT DECEMBER 31, 2020 2020 Rs '000 2019 Rs '000 Note Equity and liabilities Equity Share capital and reserves Share capital Revenue reserves Insurance reserve General reserve Unappropriated profit 6 51,000,000 51,000,000 27.497,072 7.984.136 35,481,208 511,553 3,172,624 27,497,072 1,492,423 32,162,119 285,013 Statutory and other reserves Unrealized gain/loss) on investments measured at fair value through OCI 629 86,993,390 (8,779) 83,438.353 Liabilities Non-current liabilities Long term loans from banks Subordinated debt Deposits from banking customers Lease liabilities Deferred income tax Employees retirement benefits Deferred government grants Advances from customers Long term vendor liability 7 8 9 10 11 12 13 28.774.903 599,160 3,347.788 16.974,431 6,093,589 24,581,798 18,216,421 1,499,169 31,069,424 131.156,683 19.716,427 599,400 3,766,456 17,312,174 7.102.905 27,123,119 19.182,858 1,526,911 25,709,208 122,039,458 14 15 94,177,147 42,285,528 1,371,131 6,680,285 87,830,054 18,958,369 1,658,615 4,058,444 16 Current liabilities Trade and other payables Deposits from banking customers Interest accrued Short term running finance Current portion of: Long term loans from banks Lease liabilities Long term vendor liability Security deposits Unpaid / claimed dividend 7 10 14 17 14.990172 3,041.986 9.157.498 1,302,184 211,511 173,217,442 391,367,515 11,300,239 2,440,869 12,522,539 1.359,489 1,589 140,340.207 345,818,018 Total equity and liabilities Contingencies and commitments 18 The annexed notes 1 to 53 are an integral part of these consolidated financial statements. Note 2020 Rs '000 2019 Rs '000 Assets Non-current assets Property, plant and equipment Right of use assets Intangible assets 19 20 21 193,715,646 19,419,596 25,582,008 238,717,250 190,009.353 20,176,320 28,099,965 238,285,638 Long term investments Long term loans and advances Long term loans to banking customers Contract costs 22 23 27 24 51,427 1,048,127 1,433,652 703,496 241,953,952 51,427 890,600 474,351 637,743 240,339.759 Current assets Stock in trade, stores and spares Trade debts and contract assets Loans to banking customers Loans and advances Contract costs Income tax recoverable Receivable from the Government of Pakistan Deposits, prepayments and other receivables Short term investments Cash and bank balances 25 26 27 28 24 29 30 31 32 33 3,832,884 25,436,953 28,572,647 1,553,937 2,626,170 24,837,418 2,164,072 17,160,181 30.736,733 12,492,568 149,413,563 5,642,513 21,701,204 20,899.728 1,063,243 2.511.646 24,577,280 2,164,072 10,671,218 9,076,445 7.170.910 105,478,259 Total assets 391,367,515 345,818,018 ANNUAL REPORT 2020 CONSOLIDATED STATEMENT OF PROFIT OR LOSS FOR THE YEAR ENDED DECEMBER 31, 2020 2020 Rs 000 2019 Rs '000 Note 129,542,521 (95,658,891) 33,883,630 Revenue 34 129,422,497 Cost of services 35 (96,312,058) Gross profit 33,110,439 Administrative and general expenses 36 (16,961,326) Selling and marketing expenses 37 17.119,067) Impairment loss on trade debts and contract assets 38 (3,390,604) (27,470,997) Operating profit 5,639,442 Other income 39 8,261.727 Finance costs 40 19,334,626) Profit before tax 4,566,543 Provision for income tax 41 (1.293,877) Profit after tax 3,272,666 The annexed notes 1 to 53 are an integral part of these consolidated financial statements. (16,685,230) (7.291,153) (3,225,473) (27,201.856) 6,681,774 6,156,874 19,202,708) 3,635,940 (1.258,840) 2.377,100 optel CONSOLIDATED STATEMENT OF COMPREHENSIVE INCOME FOR THE YEAR ENDED DECEMBER 31, 2020 2020 Rs '000 2019 Rs '000 Profit for the year 3,272,666 2,377.100 Other comprehensive income for the year Items that will not be reclassified to consolidated statement of profit or loss: Remeasurement gain on employees retirement benefits Impairment loss on other investment 3,976,004 568,204 (32,473) 535,731 (155,213) Tax effect 3,976,004 (1.153,041) 2,822,963 380,518 Items that may be subsequently reclassified to consolidated statement of profit or loss: Gain / (Loss) on equity instrument arising during the year Tax effect Unrealized Gain /loss) on equity instrument - net of tax Other comprehensive income for the year - net of tax Total comprehensive income for the year 11,068 (1,660) 9,408 (10,288) 1,538 (8.750) 2,832,371 371,768 6,105,037 2,748,868 The annexed notes 1 to 53 are an integral part of these consolidated financial statementsStep by Step Solution
There are 3 Steps involved in it
Step: 1

Get Instant Access to Expert-Tailored Solutions
See step-by-step solutions with expert insights and AI powered tools for academic success
Step: 2

Step: 3

Ace Your Homework with AI
Get the answers you need in no time with our AI-driven, step-by-step assistance
Get Started


