Analyze the financial trends over 5 years of Revenue, net income, and any other of the most significant financial performance results of your choice. Write about the results that you received. What important information does this analysis provide?
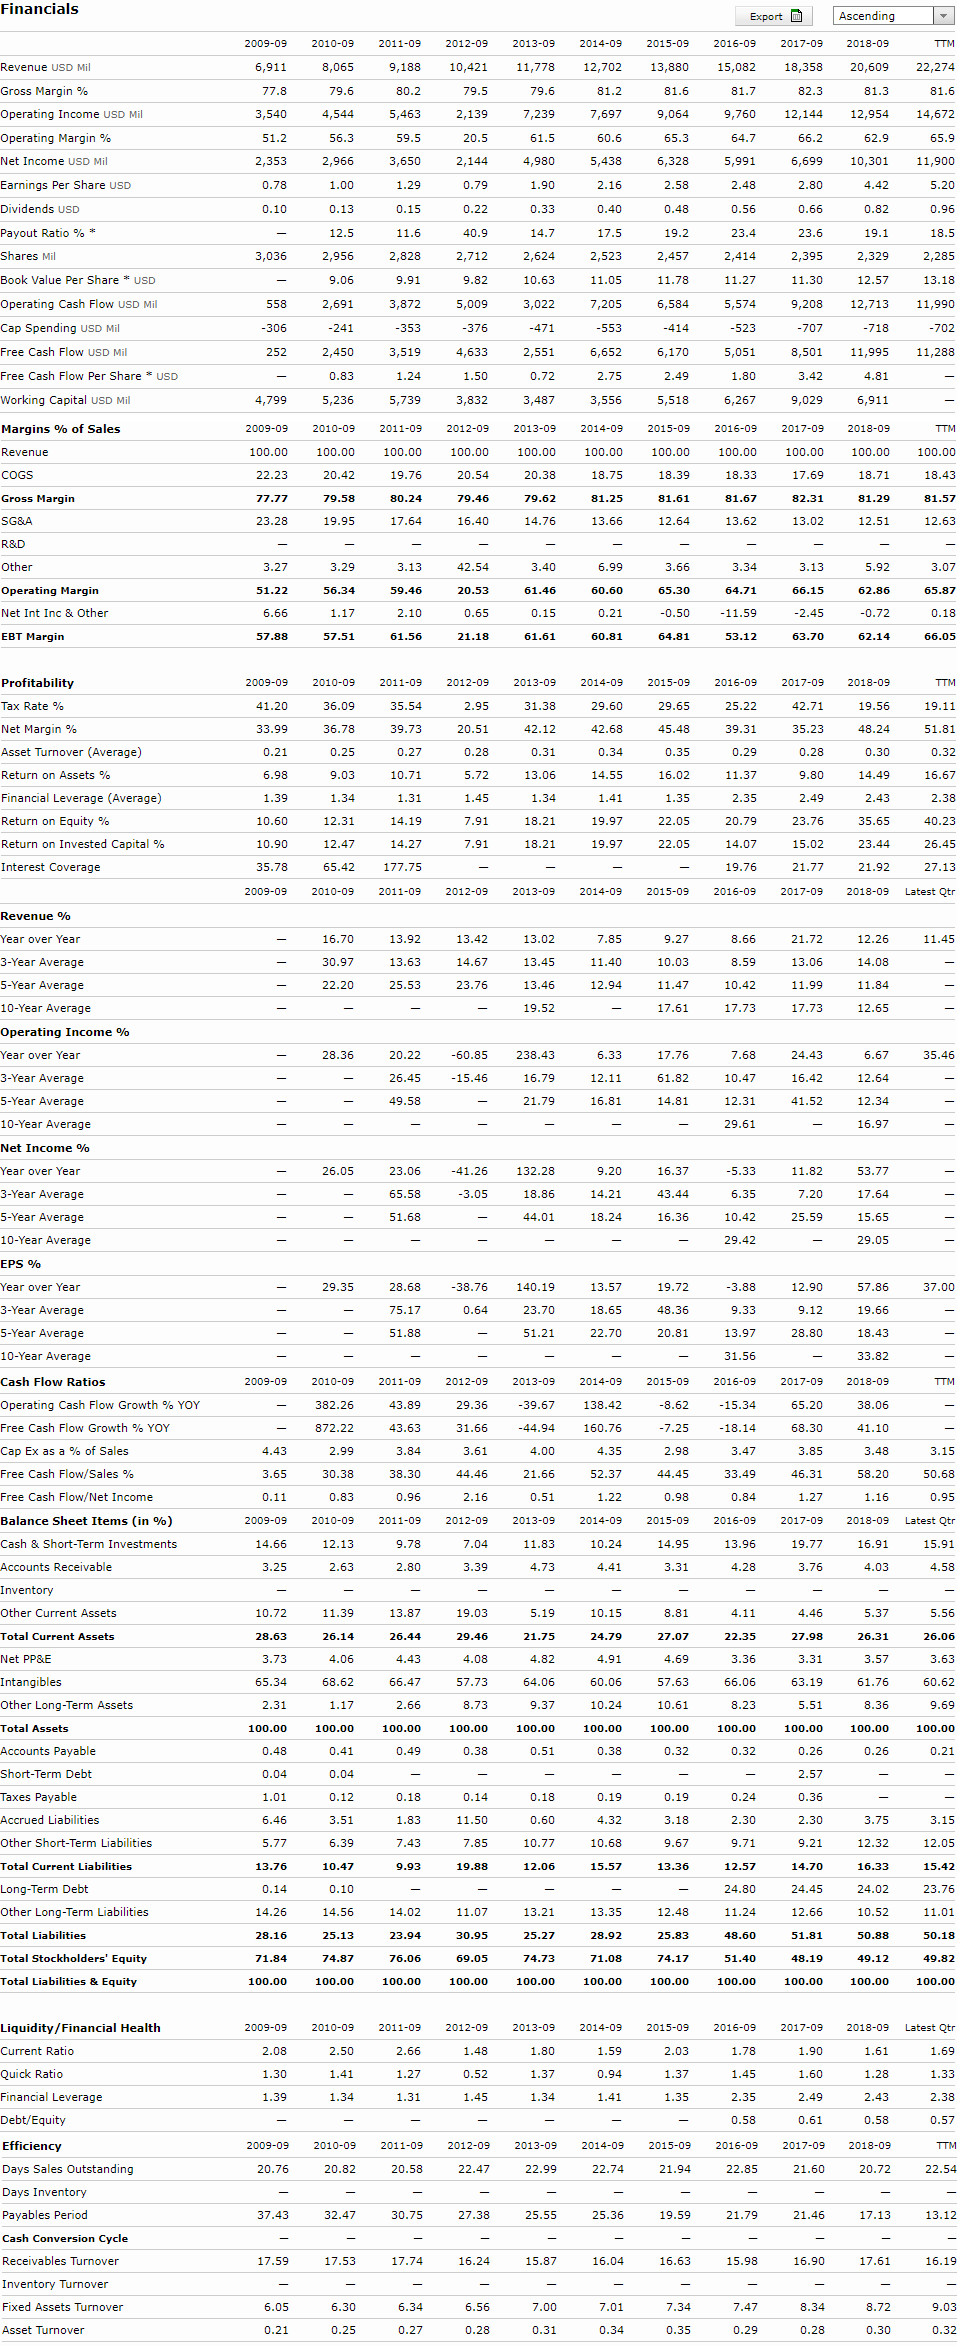
Financials 2009-09 6,911 77.8 3,540 51.2 2,353 0.78 0.10 - 3,036 - Revenue USD Mil Gross Margin % Operating Income USD Mil Operating Margin% Net Income USD Mil Earnings Per Share USD Dividends USD Payout Ratio %* Shares Mil Book Value Per Share * USD Operating Cash Flow USD Mil Cap Spending USD Mil Free Cash Flow USD Mil Free Cash Flow Per Share * USD Working Capital USD Mil Margins % of Sales Revenue COGS Gross Margin SG&A R&D 2010-09 8,065 79.6 4,544 56.3 2,966 1.00 0.13 12. 5 2,956 9.06 2,691 -241 2,450 0.83 5,236 2011-09 2012-09 9,188 10,421 80.2 79.5 5,463 2,139 59.5 20.5 3,650 2,144 1 .29 0.79 0.15 0.22 1 1.6 40. 9 2 ,828 2,712 9.919 .82 3,872 5,009 -353 -376 3,5194,633 1.24 1.50 5,739 3,832 2013-09 2014-09 11,778 12,702 79.6 81.2 7,239 7,697 61.5 60.6 4,980 5,438 1.90 2.16 0.33 0.40 1 4.7 17.5 2,524 2,523 10.63 11.05 3,022 7,205 -471 -553 2,5516 ,652 0.72 2 .75 3,4873,556 Export D Ascending 2015-09 2016-09 2017-09 2018-09 13,880 15,082 18,358 20,609 81.6 81.7 82.3 81.3 9,064 9,760 12,144 12,954 65.3 64.7 66.2 62.9 6,328 5,991 6,699 10,301 2.58 2.48 2.80 4.42 0.48 0.56 0.66 0.82 19.2 23.4 23.6 19.1 2,457 2,414 2,395 2,329 11.78 11.27 11.30 12.57 5,584 5,574 9 ,208 12,713 -414 -523 -707 -718 6,170 5,051 8,501 11,995 2.49 1.80 3.42 4.81 5,5186,267 9,0296,911 TTM 22,274 81.6 14,672 65.9 11,900 5.20 0.96 18.5 2,285 13.18 11,990 -702 11,288 558 -306 252 - 4,799 - - 2009-09 100.00 22.23 77.77 23.28 2015-09 100.00 18.39 8 1.61 12.64 2016-09 100.00 18.33 81.67 13.62 2017-09 100.00 17.69 82.31 13.02 TTM 100.00 18.43 81.57 12.63 2010-09 100.00 20.42 79.58 19.95 - 3.29 56.34 1.17 57.51 2011-09 100.00 1 9.76 80.24 17.64 - 3.13 59.46 2.10 61.56 2012-09 100.00 20.54 79.46 16.40 - 42.54 20.53 0.65 21.18 2013-09 100.00 20.38 79.62 14.76 - 3.40 61.46 0.15 61.61 2014-09 100.00 18.75 81.25 13.66 - 6.99 60.60 0.21 50.81 2018-09 100.00 18.71 81.29 12.51 - 5.92 62.86 -0.72 62.14 - Other Operating Margin Net Int Inc & Other 3.27 51.22 6.66 57.88 3.65 65.30 -0.50 64.81 3.34 64.71 -11.59 53.12 3.13 66.15 -2.45 63.70 3.07 65.87 0.18 66.05 EBT Margin Profitability Tax Rate % Net Margin % Asset Turnover (Average) Return on Assets % Financial Leverage (Average) Return on Equity % Return on Invested Capital % Interest Coverage 2009-09 41.20 33.99 0.21 6.98 1.39 10.60 2010-09 36.09 36.78 0.25 9 .03 1.34 12.31 2011-09 35.54 39.73 0.27 10.71 1 .31 14.19 2012-09 2 .95 20.51 0.28 5.72 1.45 7.91 7.91 - 2012-09 2013-09 31.38 42.12 0.31 13.06 1.34 18.21 18.21 - 2014-09 29.60 42.68 0.34 14.55 1.41 19.97 19.97 2015-09 29.65 45.48 0.35 16.02 1.35 22.05 22.05 - 2016-09 25.22 39.31 0.29 11.37 2.35 20.79 14.07 19.76 2016-09 2017-09 42.71 3 5.23 0.28 9.80 2.49 2 3.76 15.02 21.77 2017-09 2018-09 19.56 48.24 0.30 14.49 2.43 35.65 23.44 21.92 2018-09 TTM 19.11 51.81 0.32 16.67 2.38 40.23 26.45 27.13 Latest Qtr 35.78 2009-09 65.42 2010-09 177.75 2011-09 2013-09 2014-09 2015-09 - 11.45 - 16.70 30.97 22.20 13.92 13.63 2 5.53 - 13.42 14.67 23.76 - 13.02 13.45 13.46 19.52 7.85 11.40 12.94 - 9.27 10.03 11.47 17.61 8.66 8 .59 1 0.42 17.73 21.72 13.06 11.99 17.73 12.26 14.08 11.84 12.65 - - 28.36 6 35.46 20.22 26.45 49.58 -60.85 -15.46 - - 238.43 16.79 21.79 - 6.33 12.11 16.81 17.76 61.82 14.81 7.68 10.47 1 2.31 29.61 24.43 16.42 41.52 - .67 12.64 12.34 16.97 Revenue % Year over Year 3-Year Average 5-Year Average 10-Year Average Operating Income % Year over Year 3-Year Average 5-Year Average 10-Year Average Net Income % Year over Year 3-Year Average 5-Year Average 10-Year Average EPS % Year over Year 3-Year Average 5-Year Average 10-Year Average - 26.05 23.06 65.58 51.68 - -41.26 -3.05 - - 132.28 18.86 44.01 - 9.20 14.21 18.24 - 16.37 43.44 16.36 - -5.33 6.35 10.42 29.42 11.82 7.20 25.59 - 53.77 17.64 15.65 29.05 - - - - 29.35 28.68 75.17 51.88 -38.76 0.64 - 140.19 13.57 23.70 18.65 51.2122.70 37.00 - - - - Cash Flow Ratios TTM Operating Cash Flow Growth % YOY Free Cash Flow Growth % YOY Cap Ex as a % of Sales Free Cash Flow/Sales % Free Cash Flow/Net Income Balance Sheet Items (in %) Cash & Short-Term Investments Accounts Receivable Inventory Other Current Assets 2009-09 - - 4.43 3.65 0.11 2009-09 14.66 3.25 2011-09 43.89 4 3.63 3.84 38.30 0.96 2011-09 9 .78 2.80 - 13.87 26.44 4.43 66.47 2.66 100.00 0.49 2012-09 29.35 31.66 3.61 44.46 2.16 2012-09 7.04 3.39 2014-09 138.42 160.76 4.35 52.37 1 .22 2014-09 10.24 4.41 3.15 50.68 0.95 Latest Qtr 15.91 4.58 19.72 4 8.36 20.81 - 2015-09 -8.62 -7.25 2.98 44.45 0.98 2015-09 14.95 3.31 - 8.81 27.07 4.69 57.63 10.61 100.00 0.32 - 0.19 3.18 9.67 13.36 - 2010-09 382.26 872.22 2.99 30.38 0.83 2010-09 12.13 2.63 - 11.39 26.14 4.06 68.62 1.17 100.00 0.41 0.04 0.12 3.51 6.39 10.47 0.10 14.56 25.13 74.87 10.72 28.63 3.73 65.34 2.31 100.00 0.48 2013-09 -39.67 -44.94 4.00 21.66 0.51 2013-09 11.83 4 .73 - 5.19 21.75 4.82 64.06 9.37 100.00 0.51 - 0.18 0.50 10.77 12.06 Total Current Assets 10.15 24.79 4.91 60.06 10.24 100.00 0.38 -3.88 9.33 13.97 31.56 2016-09 -15.34 -18.14 3.47 3 3.49 0.84 2016-09 13.96 4.28 - 4.11 22.35 3.36 66.06 8.23 100.00 0.32 - 0.24 2.30 9.71 12.57 24.80 11.24 48.60 51.40 12.90 57.86 9.12 19.66 28.80 18.43 - 33.82 2017-09 2018-09 65.20 38.06 68.30 41.10 3.85 3.48 46.31 58.20 1.27 1.16 2017-09 2018-09 19.77 16.91 3.76 4.03 - 4.46 5.37 27.98 26.31 3.31 3.57 63.19 6 1.76 5 .518 .36 100.00 100.00 0.26 0.26 2.57 - 0.36 2.30 3.75 9.21 12.32 14.70 16.33 24.45 24.02 12.66 10.52 51.81 50.88 48.19 4 9.12 19.03 29.46 4.08 57.73 8.73 100.00 0 .38 - 0.14 11.50 7.85 19.88 - 11.07 30.95 6 9.05 5.56 26.06 3.63 60.62 9.69 100.00 0.21 - Net PP&E Intangibles Other Long-Term Assets Total Assets Accounts Payable Short-Term Debt Taxes Payable Accrued Liabilities Other Short-Term Liabilities Total Current Liabilities Long-Term Debt Other Long-Term Liabilities Total Liabilities Total Stockholders' Equity Total Liabilities & Equity 4 0.04 1.01 6.46 5.77 13.76 0.14 14.26 28.16 71.84 0.18 1.83 .43 9.93 7 0.19 .32 10.68 15.57 - 13.35 28.92 71.08 3.15 12.05 15.42 23.76 11.01 50.18 49.82 14.02 23.94 76.06 13.21 25.27 74.73 12.48 25.83 74.17 100.00 100.00 100.00 100.00 100.00 100.00 100.00 100.00 100.00 100.00 100.00 2009-09 2.08 1.30 1.39 2010-09 2.50 1.41 1.34 - 2010-09 20.82 2011-09 2.66 1.27 1.31 - 2011-09 20.58 2012-09 1.48 0.52 1.45 - 2012-09 22.47 2013-09 1.80 1.37 1.34 - 2013-09 22.99 2009-09 20.76 Liquidity/Financial Health Current Ratio Quick Ratio Financial Leverage Debt/Equity Efficiency Days Sales Outstanding Days Inventory Payables Period Cash Conversion Cycle Receivables Turnover Inventory Turnover Fixed Assets Turnover Asset Turnover 2014-09 2015-09 1.592.03 0.94 1.37 1.41 1.35 - - 2014-09 2015-09 22.74 21.94 - 25.36 19.59 - - 16.04 16.63 2016-09 2017-09 2018-09 Latest Qtr 1.781.901.611.69 1.45 1.60 1.28 1.33 2.35 2.49 2.43 2.38 0.58 0.61 0.58 0.57 2016-09 2017-09 2018-09 TTM 22.85 21.60 20.72 22.54 - - - 21.79 21.46 17.13 13.12 - 15.98 16.90 17.61 16.19 37.43 32.47 25.55 30.75 - 17.74 27.38 - 16.24 17.59 17.53 15.87 9 6.05 0.21 6.30 0.25 6.34 0.27 6.56 0.28 7.00 0.31 7.01 0.34 7.34 0.35 7.47 0.29 8.34 0.28 8.72 0.30 .03 0.32