Answered step by step
Verified Expert Solution
Question
1 Approved Answer
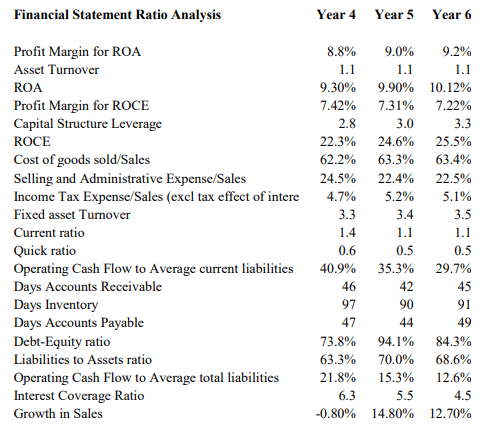
Analyze the profitability, liquidity, and solvency for Heinz Company over 3-year period. Financial Statement Ratio Analysis Year 4 Year 5 Year 6 8.8% 9.0% 9.2%
Analyze the profitability, liquidity, and solvency for Heinz Company over 3-year period.

Financial Statement Ratio Analysis Year 4 Year 5 Year 6 8.8% 9.0% 9.2% 1.1 1.1 1.1 9.30% 9.90% 10.12% 7.42% 7.31% 7.22% 2.8 3.0 22.3% 24.6% 3.3 25.5% 63.4% 62.2% 63.3% 24.5% 22.4% 4.7% 3.3 1.4 5.2% 3.4 Profit Margin for ROA Asset Turnover ROA Profit Margin for ROCE Capital Structure Leverage ROCE Cost of goods sold/Sales Selling and Administrative Expense/Sales Income Tax Expense/Sales (excl tax effect of intere Fixed asset Turnover Current ratio Quick ratio Operating Cash Flow to Average current liabilities Days Accounts Receivable Days Inventory Days Accounts Payable Debt-Equity ratio Liabilities to Assets ratio Operating Cash Flow to Average total liabilities Interest Coverage Ratio Growth in Sales 22.5% 5.1% 3.5 1.1 1.1 0.5 0.5 0.6 40.9% 46 29.7% 35.3% 42 45 97 90 91 47 44 49 73.8% 94.1% 84.3% 70.0% 63.3% 21.8% 68.6% 12.6% 15.3% 6.3 5.5 4.5 -0.80% 14.80% 12.70%
Step by Step Solution
There are 3 Steps involved in it
Step: 1

Get Instant Access to Expert-Tailored Solutions
See step-by-step solutions with expert insights and AI powered tools for academic success
Step: 2

Step: 3

Ace Your Homework with AI
Get the answers you need in no time with our AI-driven, step-by-step assistance
Get Started


