

Question
Analyze the water quality data from each of the fore-bays in the city of Huntington Beach. The fore-bays were sampled daily over the course of
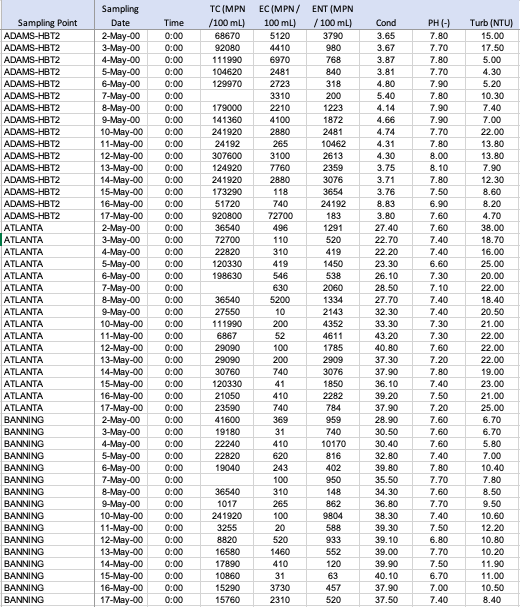
Analyze the water quality data from each of the fore-bays in the city of Huntington Beach. The fore-bays were sampled daily over the course of the roughly two week study. In this activity you will calculate 95% 2-sided confidence intervals on the average concentration of the various bacteria in each fore-bay.
Our first method is the "manual" method. In this method, we calculate each term individually. Start with one of the pump stations, Adams-HBT, since alphabetically its first, and one of the bacteria, TC. x ? is calculated by using the AVERAGE function, s is calculated by using the STDEV.S function. n from the COUNT, and z?/2 fromNORM.S.INV.If all goes well, the terms in your confidence interval expression should be 194270 1.96 215127.8/?15If your values don't match, you've screwed up; fixit before continuing.We can speed things up a bit by using CONFIDENCE.NORM(alpha, stdev, n). The value returned should be identical to the second term in our confidence interval expression. If you don't get 108867.7, you've screwed up.We want to calculate each term separately - the average and the interval range - because when we plot the data, we will plot the average and add positive and negative error bars to indicate the confidence interval. We don't want to calculate the value for the lower limit and the upper limit.At this point you realize you need to repeat this three times - once for each of the bacteria - and then repeat the entire process for each pump station. That's a lot of repetition. Certainly if you set things up properly, it is possible to copy the cells and get an answer fairly quickly. But let's see if we can do it even quicker. In Excel, on the Insert tab, you'll find the PivotTable button. Highlight your data, click that button and create Pivot Table on a new sheet. In the list of fields, drag Sampling Point to the Rows area, then drag TC to the Values area. You'll notice it's no longer just TC but it says "Count of TC" or some other function. If you right-click this TC expression and choose Field Settings, a window opens that contains a whole host of useful functions, several of which we can use for this assignment. Drag TC to the Values area two more times, for a total of 3 TCs. Set one to Average, one to StdDev and one to Count (or Count Numbers). Voil`a. You now have a table that contains all of the necessary data calculations needed to find the confidence interval at every pump station for TC. You can repeat this for the other two bacteria. Once you've created the table that has all of the values you need, it's easiest to copy and paste as value, so you can easily interact with the data. Use excel for all of this
Step by Step Solution
There are 3 Steps involved in it
Step: 1

Get Instant Access to Expert-Tailored Solutions
See step-by-step solutions with expert insights and AI powered tools for academic success
Step: 2

Step: 3
Ace Your Homework with AI
Get the answers you need in no time with our AI-driven, step-by-step assistance
Get Started
Advanced Engineering Mathematics
Authors: ERWIN KREYSZIG
9th Edition
0471488852, 978-0471488859