- Analyzing financial statements by applying financial ratios and writing an explanation about the ratios.
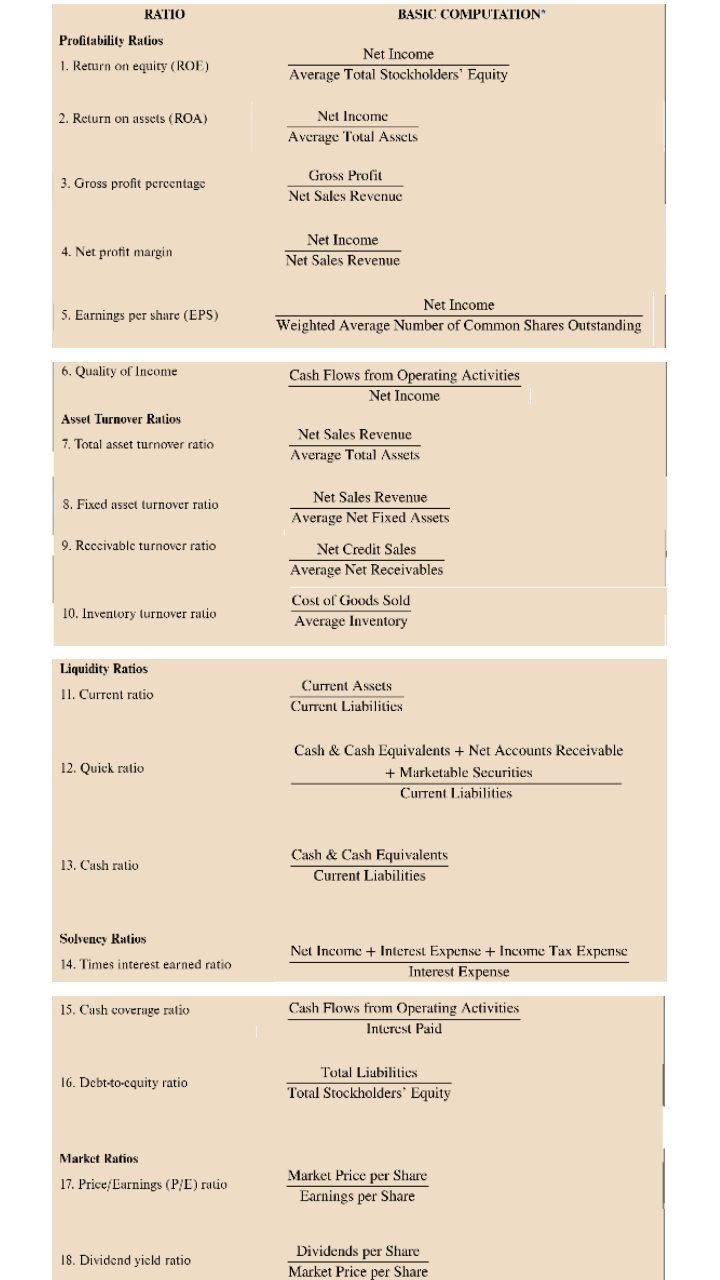
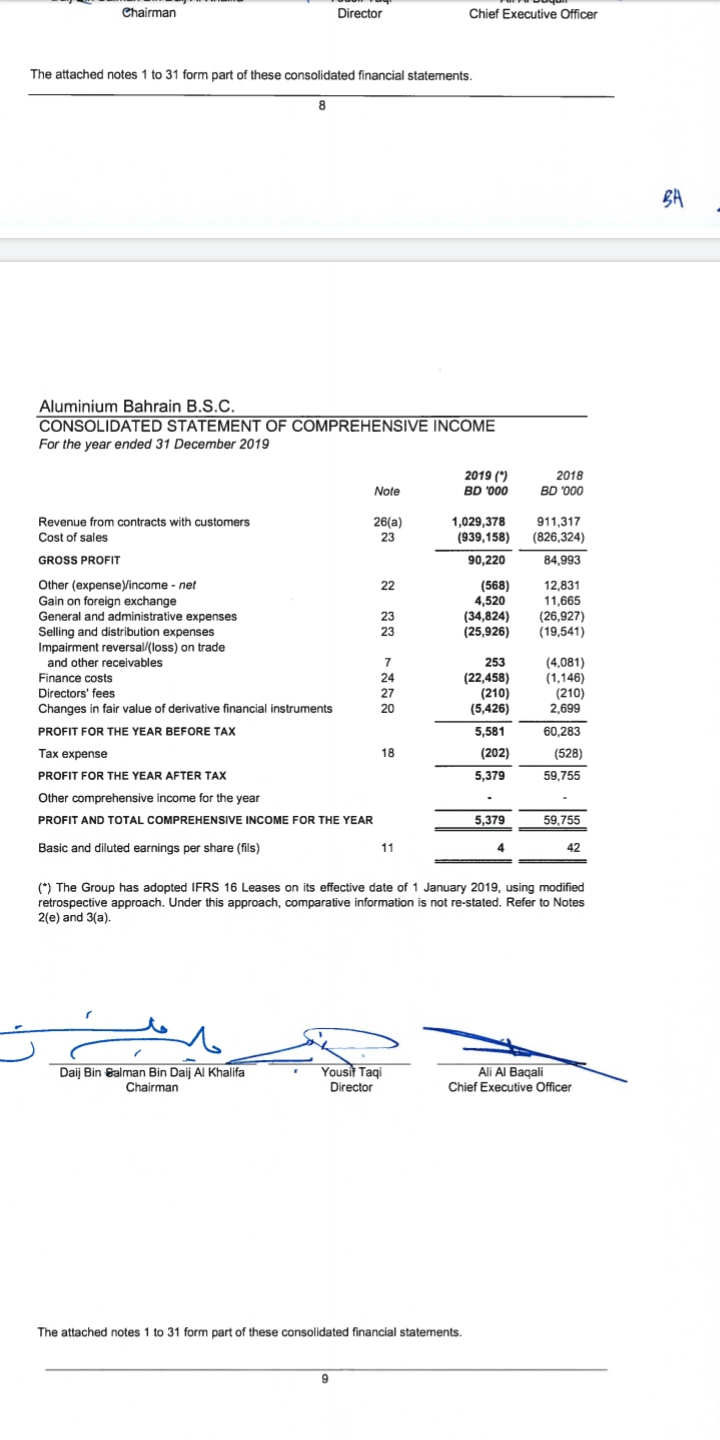
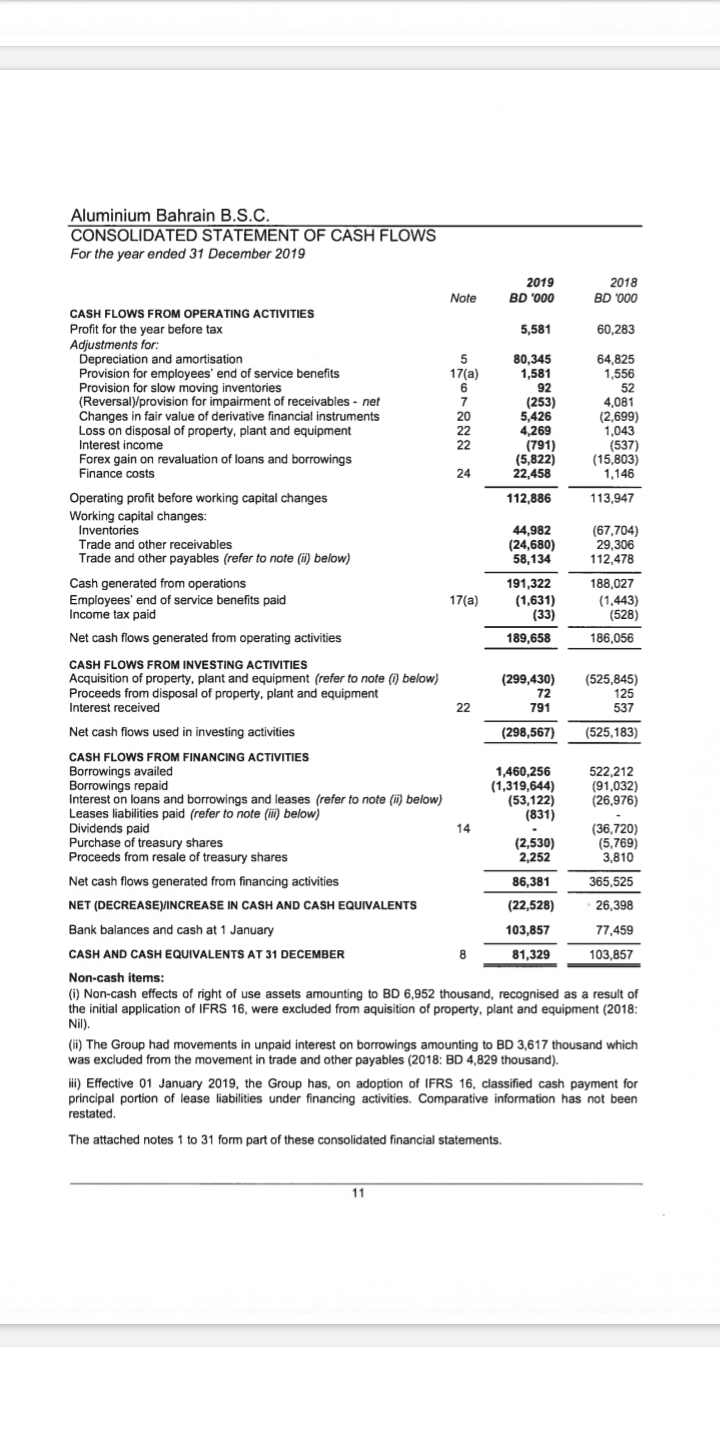
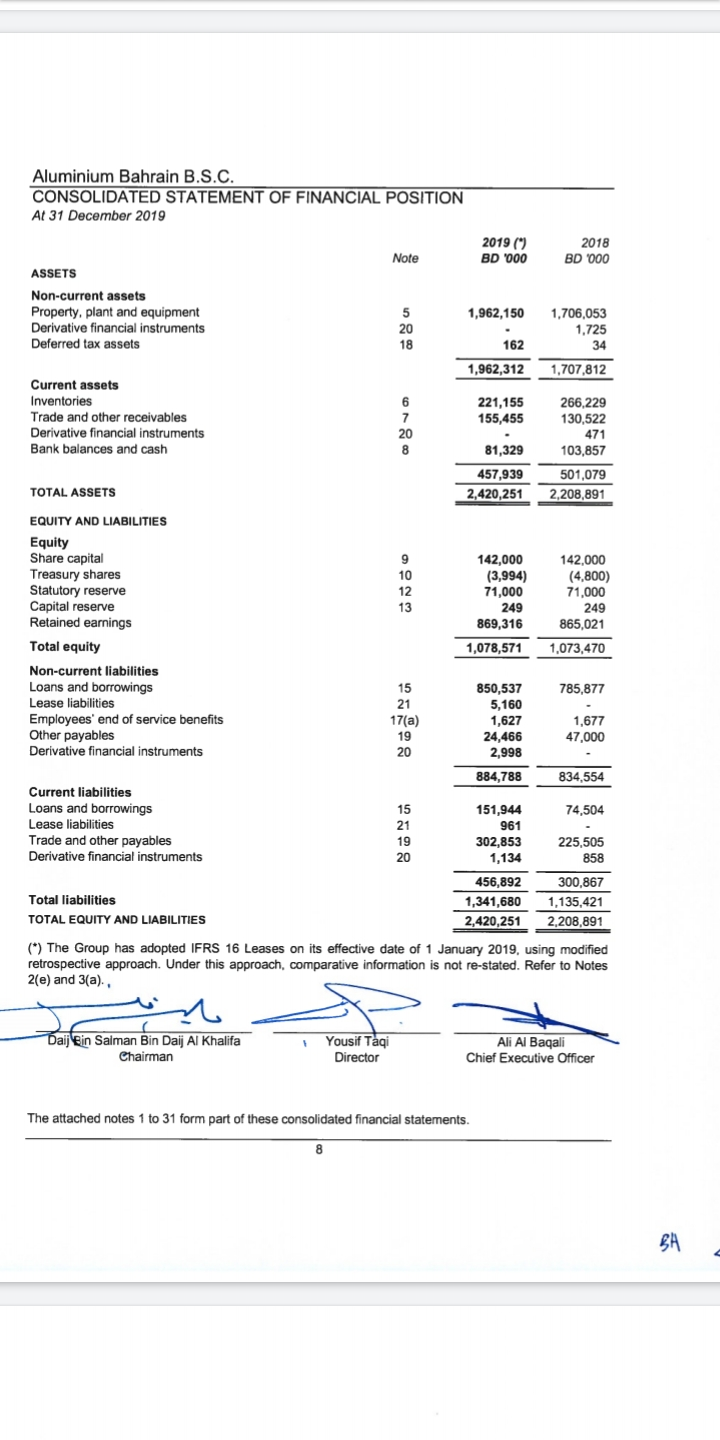
RATIO BASIC COMPUTATION Profitability Ratios 1. Return on equity (ROE) Net Income Average Total Stockholders' Equity 2. Return on assets (ROA) Net Income Average Total Assets 3. Gross profit percentage Gross Profit Net Sales Revenue 4. Net profit margin Net Income Net Sales Revenue 5. Earnings per share (EPS) Net Income Weighted Average Number of Common Shares Outstanding 6. Quality of Income Cash Flows from Operating Activities Net Income Asset Turnover Ratios 7. Total asset turnover ratio Net Sales Revenue Average Total Assets 8. Fixed asset turnover ratio Net Sales Revenue Average Net Fixed Assets 9. Reccivable turnover ratio Net Credit Sales Average Net Receivables Cost of Goods Sold Average Inventory 10. Inventory turnover ratio Liquidity Ratios 11. Current ratio Current Assets Current Liabilities 12. Quick ratio Cash & Cash Equivalents + Net Accounts Receivable + Marketable Securities Current Liabilities 13. Cash ratio Cash & Cash Equivalents Current Liabilities Solvency Ratios 14. Times interest earned ratio Net Income + Interest Expense + Income Tax Expense Interest Expense 15. Cash coverage ratio Cash Flows from Operating Activities Interest Paid 16. Debt-to-cquity ratio Total Liabilities Total Stockholders' Equity Market Ratios 17. Price/Earnings (P/E) ratio Market Price per Share Earnings per Share 18. Dividend yield ratio Dividends per Share Market Price per Share Chairman Director Chief Executive Officer The attached notes 1 to 31 form part of these consolidated financial statements. BA Aluminium Bahrain B.S.C. CONSOLIDATED STATEMENT OF COMPREHENSIVE INCOME For the year ended 31 December 2019 2019 (*) BD '000 2018 BD 000 Note Revenue from contracts with customers Cost of sales GROSS PROFIT 26(a) 23 1,029,378 (939,158) 90,220 911,317 (826,324) 84.993 (568) 4,520 (34,824) (25,926) 12,831 11,665 (26,927) (19,541) Other (expense Vincome - net Gain on foreign exchange General and administrative expenses Selling and distribution expenses Impairment reversal/(loss) on trade and other receivables Finance costs Directors' fees Changes in fair value of derivative financial instruments PROFIT FOR THE YEAR BEFORE TAX Tax expense PROFIT FOR THE YEAR AFTER TAX Other comprehensive income for the year PROFIT AND TOTAL COMPREHENSIVE INCOME FOR THE YEAR 253 (22,458) (210) (5,426) 5,581 (202) 5,379 (4,081) (1.146) (210) 2,699 60,283 (528) 59,755 5,379 59,755 Basic and diluted earnings per share (fils) 11 42 (*) The Group has adopted IFRS 16 Leases on its effective date of 1 January 2019, using modified retrospective approach. Under this approach, comparative information is not re-stated. Refer to Notes 2(e) and 3(a). C Daij Bin Salman Bin Daij Al Khalifa Chairman Yousif Taqi Director Ali Al Baqali Chief Executive Officer The attached notes 1 to 31 form part of these consolidated financial statements. Aluminium Bahrain B.S.C. CONSOLIDATED STATEMENT OF CASH FLOWS For the year ended 31 December 2019 Note 2019 BD '000 2018 BD 4000 5,581 60,283 64,825 1,556 CASH FLOWS FROM OPERATING ACTIVITIES Profit for the year before tax Adjustments for: Depreciation and amortisation Provision for employees' end of service benefits Provision for slow moving inventories (Reversal provision for impairment of receivables - net Changes in fair value of derivative financial instruments Loss on disposal of property, plant and equipment Interest income Forex gain on revaluation of loans and borrowings Finance costs 52 80,345 1,581 92 (253) 5,426 4,269 (791) (5,822) 22,458 4,081 (2,699) 1,043 (537) (15,803) 1,146 112,886 113,947 Operating profit before working capital changes Working capital changes: Inventories Trade and other receivables Trade and other payables (refer to note (ii) below) 44,982 (24,680) 58,134 (67.704) 29,306 112,478 17(a) Cash generated from operations Employees' end of service benefits paid Income tax paid Net cash flows generated from operating activities 191,322 (1,631) (33) 189,658 188,027 (1,443) (528) 186,056 72 537 CASH FLOWS FROM INVESTING ACTIVITIES Acquisition of property, plant and equipment (refer to note (below) (299,430) (525,845) Proceeds from disposal of property, plant and equipment 125 Interest received 22 791 Net cash flows used in investing activities (298,567) (525,183) CASH FLOWS FROM FINANCING ACTIVITIES Borrowings availed 1,460,256 522,212 Borrowings repaid (1,319,644) (91,032) Interest on loans and borrowings and leases (refer to note (ii) below) (53,122) (26,976) Leases liabilities paid (refer to note (iii) below) (831) Dividends paid (36,720) Purchase of treasury shares (2,530) (5,769) Proceeds from resale of treasury shares 2,252 3,810 Net cash flows generated from financing activities 86,381 365,525 NET (DECREASEY/INCREASE IN CASH AND CASH EQUIVALENTS (22,528) 26,398 Bank balances and cash at 1 January 103,857 77,459 CASH AND CASH EQUIVALENTS AT 31 DECEMBER 81,329 103,857 Non-cash items: (1) Non-cash effects of right of use assets amounting to BD 6,952 thousand, recognised as a result of the initial application of IFRS 16, were excluded from aquisition of property, plant and equipment (2018: Nil). (ii) The Group had movements in unpaid interest on borrowings amounting to BD 3,617 thousand which was excluded from the movement in trade and other payables (2018: BD 4,829 thousand). ii) Effective 01 January 2019, the Group has, on adoption of IFRS 16, classified cash payment for principal portion of lease liabilities under financing activities. Comparative information has not been restated. The attached notes 1 to 31 form part of these consolidated financial statements. Aluminium Bahrain B.S.C. CONSOLIDATED STATEMENT OF FINANCIAL POSITION At 31 December 2019 2019 (1) BD '000 2018 BD 000 Note ASSETS 1,962,150 Non-current assets Property, plant and equipment Derivative financial instruments Deferred tax assets 1,706,053 1,725 162 1,962,312 1,707,812 Current assets Inventories Trade and other receivables Derivative financial instruments Bank balances and cash 221,155 155,455 266,229 130,522 471 103,857 81,329 457,939 2,420,251 501,079 2,208,891 TOTAL ASSETS appet EQUITY AND LIABILITIES Equity Share capital Treasury shares Statutory reserve Capital reserve Retained earnings Total equity Non-current liabilities Loans and borrowings Lease liabilities Employees' end of service benefits Other payables Derivative financial instruments 142,000 (3,994) 71,000 249 869,316 1,078,571 142.000 (4,800) 71,000 249 865,021 1,073,470 785,877 o 17(a 850,537 5,160 1,627 24,466 2,998 1,677 47,000 p 884,788 834,554 74,504 Current liabilities Loans and borrowings Lease liabilities Trade and other payables Derivative financial instruments 25 ?? 151,944 961 302,853 1,134 456,892 1,341,680 2,420,251 225,505 858 300,867 1,135,421 2,208,891 Total liabilities TOTAL EQUITY AND LIABILITIES (*) The Group has adopted IFRS 16 Leases on its effective date of 1 January 2019, using modified retrospective approach. Under this approach, comparative information is not re-stated. Refer to Notes 2(e) and 3(a).. - Daij bin Salman Bin Daij Al Khalifa Chairman Yousif Taqi Director Ali Al Baqali Chief Executive Officer The attached notes 1 to 31 form part of these consolidated financial statements


