Answered step by step
Verified Expert Solution
Question
1 Approved Answer
Analyzing San Fernando Earthquake Ground Motion Analyzing San Fernando Earthquake Ground Motion My Solutions > In this problem, you are supposed to analyze and extract
Analyzing San Fernando Earthquake Ground Motion Analyzing San Fernando Earthquake Ground Motion
My Solutions
In this problem, you are supposed to analyze and extract some basic features of an earthquake ground motion.
The files SFHtxt SFHtxt and SFVtxt contain two horizontal and one vertical acceleration components from San
Fernando earthquake recorded at Via Tejon station. The records are obtained from PEER ground motion
database.
The following tasks are intended to be fulfilled:
Please start by loading the three componenets of the ground motion that are provided to you. You may use
texreadfile names' to load the data, and name veriables as SFH SFH and SFV
The data are recorded at the time step of second ie the spacing between adjacent timestamps is
Create a variable, Time, which starts from and contains the timestamps of the same length as the other vectors
SFH SFH and SFV
List data in a timetable for more convenience. Create a timetable with the time and three acceleration variables
and name it as quakeData. Display the first ten rows using the head function.
Choose first horizontal component of the ground motion amplitude SFH data and plot it against Time. Title this
figure as "First Horizontal Component".
Visualize the three acceleration components on three different axes. Use subplots to visulaize your data.
The speed of shockwave propagation is the integration of the accelerations over time. Use cumulative sums
cumsum along the time variable for SFH SFH and SFV to get the velocity of the wavefront. Name the velocity
veriables as VeISFH VeISFH and VeISFV, respectively.
Plot the components of the velocity against the time interval. Use subplots to plot the velocities.
My Solutions
In this problem, you are supposed to analyze and extract some basic features of an earthquake ground motion.
The files SFHtxt SFHtxt and SFVtxt contain two horizontal and one vertical acceleration components from San
Fernando earthquake recorded at Via Tejon station. The records are obtained from PEER ground motion
database.
The following tasks are intended to be fulfilled:
Please start by loading the three componenets of the ground motion that are provided to you. You may use
texreadfile names' to load the data, and name veriables as SFH SFH and SFV
The data are recorded at the time step of second ie the spacing between adjacent timestamps is
Create a variable, Time, which starts from and contains the timestamps of the same length as the other vectors
SFH SFH and SFV
List data in a timetable for more convenience. Create a timetable with the time and three acceleration variables
and name it as quakeData. Display the first ten rows using the head function.
Choose first horizontal component of the ground motion amplitude SFH data and plot it against Time. Title this
figure as "First Horizontal Component".
Visualize the three acceleration components on three different axes. Use subplots to visulaize your data.
The speed of shockwave propagation is the integration of the accelerations over time. Use cumulative sums
cumsum along the time variable for SFH SFH and SFV to get the velocity of the wavefront. Name the velocity
veriables as VeISFH VeISFH and VeISFV, respectively.
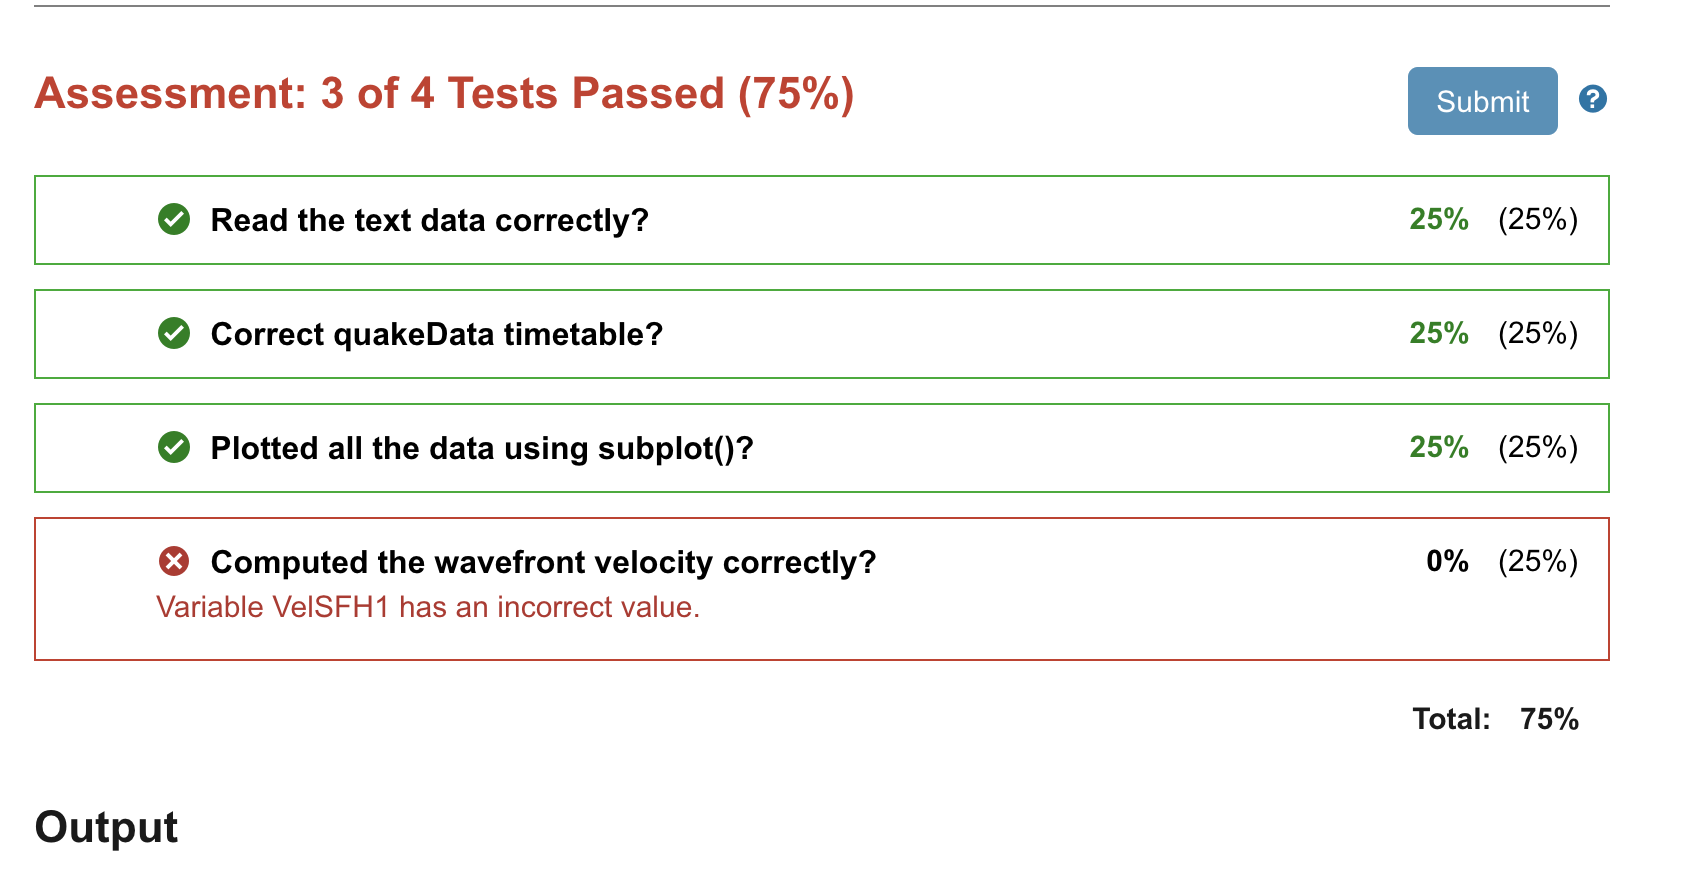
Plot the components of the velocity against the time interval. Use subplots to plot the velocities.Assessment: of Tests Passed
Read the text data correctly?
Correct quakeData timetable?
Plotted all the data using subplot
Computed the wavefront velocity correctly?
Variable VeISFH has an incorrect value.

Step by Step Solution
There are 3 Steps involved in it
Step: 1

Get Instant Access to Expert-Tailored Solutions
See step-by-step solutions with expert insights and AI powered tools for academic success
Step: 2

Step: 3

Ace Your Homework with AI
Get the answers you need in no time with our AI-driven, step-by-step assistance
Get Started


