Answered step by step
Verified Expert Solution
Question
1 Approved Answer
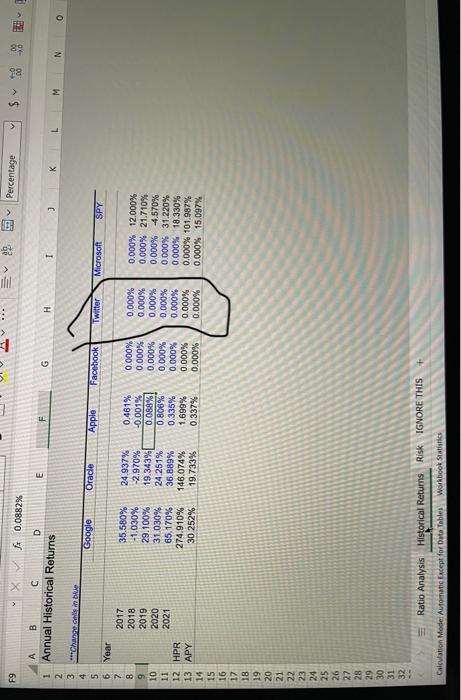
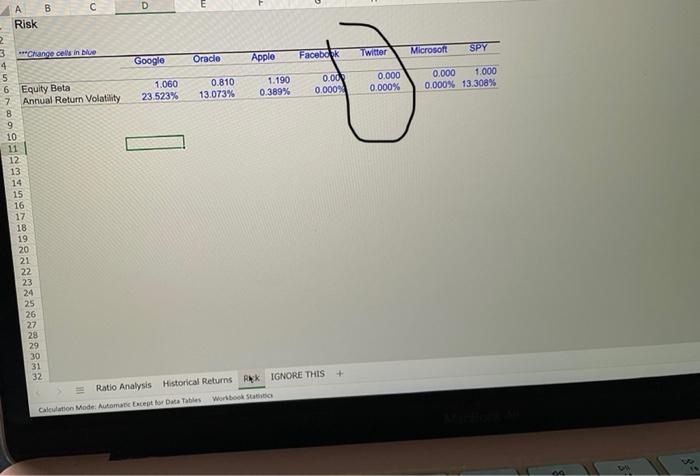
Annual Historical returns for the last five years of Twitter, and the equity beta and the Annual Return Volatility. I need the yearly amounts for
Annual Historical returns for the last five years of Twitter, and the equity beta and the Annual Return Volatility. 


I need the yearly amounts for the questions, i need twitter's financial records from 2017-21 on the problems, pls help
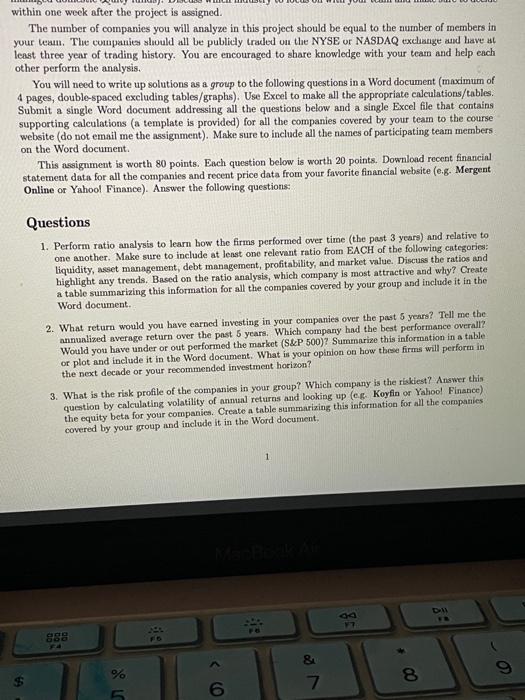
*** F9 W 22 Percentage Xfx 0.0882% E G H I 3 K L M N A B D 1 Annual Historical Returns 2 Channelse Google O Oracle Apple Facebook Twitter Microsoft SPY 2017 2018 2019 2020 2021 35.580% -1.030% 29.100% 31.030% 65.170% 274.910% 30 252% 24.937% -2.970% 19.343% 24.251% 36.889% 146.074% 19.733% 0.461% -0.001% 0.08.8% 0.806% 0.335% 1.699% 0.337% 0.000% 0.000% 0.000% 0.000% 0.000% 0.000% 0.000% 0.000% 0.000% 0.000% 0.000% 0.000% 0.000% 0.000% 0.000% 12.000% 0.000% 21.710% 0.000% -4.570% 0.000% 31.220% 0.000% 18.330% 0.000% 101.987% 0.000% 15.097% 6 Year 7 8 9 10 11 12 HPR 13 APY 14 15 16 17 18 19 20 21 22 23 24 25 26 27 28 29 30 31 32 1898 Ratio Analysis Historical Returns Risk IGNORE THIS Calculation Model Automatic Except for Data Tables Workbook Statistics D SPY Twitter Microsoft Facebook Oracle Apple Google 1.060 23.523% 0.810 13.073% 1.190 0389% 0.00 0.000 0.000 0.000% 0.000 1.000 0.000% 13,308% B Risk 2 3 Change cells in blue 4 5 6 Equity Beta 7 Annual Return Volatility 8 9 10 11 12 13 14 15 16 17 18 19 20 21 22 23 25 Seagg282 29 30 31 32 Ratio Analysis Historical Returns RK IGNORE THIS Calculation Mode: Automan Except for Data Tables Wortbook stat within one week after the project is assigned. The number of companies you will analyze in this project should be equal to the number of members in your team. The companies should all be publicly traded on the NYSE or NASDAQ exchange and have at least three year of trading history. You are encouraged to share knowledge with your team and help each other perform the analysis. You will need to write up solutions as a group to the following questions in a Word document (maximum of 4 pages, double-spaced excluding tables/graphs). Use Excel to make all the appropriate calculations/tables. Submit a single Word document addressing all the questions below and a single Excel file that contains supporting calculations (a template is provided) for all the companies covered by your team to the course website (do not email me the assignment). Make sure to include all the names of participating team members on the Word document. This assignment is worth 80 points. Each question below is worth 20 points. Download recent financial statement data for all the companies and recent price data from your favorite financial website (e.g. Mergent Online or Yahoo! Finance). Answer the following questions: Questions 1. Perform ratio analysis to learn how the firms performed over time (the past 3 years) and relative to one another. Make sure to include at least one relevant ratio from EACH of the following categories: liquidity, asset management, debt management, profitability, and market value. Discuss the ratios and highlight any trends. Based on the ratio analysis, which company is most attractive and why? Create a table summarizing this information for all the companies covered by your group and include it in the Word document... 2. What return would you have earned investing in your companies over the past 5 years? Tell me the annualized average return over the past 5 years. Which company had the best performance overall? Would you have under or out performed the market (S&P 500)? Summarize this information in a table or plot and include it in the Word document. What is your opinion on how these firms will perform in the next decade or your recommended investment horizon? 3. What is the risk profile of the companies in your group? Which company is the riskiest? Answer this question by calculating volatility of annual returns and looking up (e.g. Koyfin or Yahoo! Finance) the equity beta for your companies. Create a table summarizing this information for all the companies. covered by your group and include it in the Word document. Dil FR 888 FA 9 8 69 % de 6 & 7 38 - 1 Annual Historical Returns 2 3 ***Change cells in blue 4 5 6 Year 7 2017 2018 8 2019 2020 2021 9 10 11 12 HPR 13 APY 14 15 16 5678 17 18 Google 35.580% -1.030% 29.100% 31.030% 65.170% 274.910% 30 252% G Apple Facebook 24.937% 0.461% 0.000% -2.970% -0.001% 0.000% 19.343% 0.088% 0.000% 24.251% 0.806% 0.000% 36.889% 0.335% 0.000% 146.074% 1.699% 0.000% 19.733% 0.337% 0.000% Oracle H Twitter 0.000% 0.000% 0.000% 0.000% 0.000% 0.000% 0.000% I J Microsoft SPY 0.000% 12.000% 0.000% 21.710% 0.000% 4.570% 0.000% 31.220% 0.000% 18.330% 0.000% 101.987% 0.000% 15.097% K M N O *** F9 W 22 Percentage Xfx 0.0882% E G H I 3 K L M N A B D 1 Annual Historical Returns 2 Channelse Google O Oracle Apple Facebook Twitter Microsoft SPY 2017 2018 2019 2020 2021 35.580% -1.030% 29.100% 31.030% 65.170% 274.910% 30 252% 24.937% -2.970% 19.343% 24.251% 36.889% 146.074% 19.733% 0.461% -0.001% 0.08.8% 0.806% 0.335% 1.699% 0.337% 0.000% 0.000% 0.000% 0.000% 0.000% 0.000% 0.000% 0.000% 0.000% 0.000% 0.000% 0.000% 0.000% 0.000% 0.000% 12.000% 0.000% 21.710% 0.000% -4.570% 0.000% 31.220% 0.000% 18.330% 0.000% 101.987% 0.000% 15.097% 6 Year 7 8 9 10 11 12 HPR 13 APY 14 15 16 17 18 19 20 21 22 23 24 25 26 27 28 29 30 31 32 1898 Ratio Analysis Historical Returns Risk IGNORE THIS Calculation Model Automatic Except for Data Tables Workbook Statistics D SPY Twitter Microsoft Facebook Oracle Apple Google 1.060 23.523% 0.810 13.073% 1.190 0389% 0.00 0.000 0.000 0.000% 0.000 1.000 0.000% 13,308% B Risk 2 3 Change cells in blue 4 5 6 Equity Beta 7 Annual Return Volatility 8 9 10 11 12 13 14 15 16 17 18 19 20 21 22 23 25 Seagg282 29 30 31 32 Ratio Analysis Historical Returns RK IGNORE THIS Calculation Mode: Automan Except for Data Tables Wortbook stat within one week after the project is assigned. The number of companies you will analyze in this project should be equal to the number of members in your team. The companies should all be publicly traded on the NYSE or NASDAQ exchange and have at least three year of trading history. You are encouraged to share knowledge with your team and help each other perform the analysis. You will need to write up solutions as a group to the following questions in a Word document (maximum of 4 pages, double-spaced excluding tables/graphs). Use Excel to make all the appropriate calculations/tables. Submit a single Word document addressing all the questions below and a single Excel file that contains supporting calculations (a template is provided) for all the companies covered by your team to the course website (do not email me the assignment). Make sure to include all the names of participating team members on the Word document. This assignment is worth 80 points. Each question below is worth 20 points. Download recent financial statement data for all the companies and recent price data from your favorite financial website (e.g. Mergent Online or Yahoo! Finance). Answer the following questions: Questions 1. Perform ratio analysis to learn how the firms performed over time (the past 3 years) and relative to one another. Make sure to include at least one relevant ratio from EACH of the following categories: liquidity, asset management, debt management, profitability, and market value. Discuss the ratios and highlight any trends. Based on the ratio analysis, which company is most attractive and why? Create a table summarizing this information for all the companies covered by your group and include it in the Word document... 2. What return would you have earned investing in your companies over the past 5 years? Tell me the annualized average return over the past 5 years. Which company had the best performance overall? Would you have under or out performed the market (S&P 500)? Summarize this information in a table or plot and include it in the Word document. What is your opinion on how these firms will perform in the next decade or your recommended investment horizon? 3. What is the risk profile of the companies in your group? Which company is the riskiest? Answer this question by calculating volatility of annual returns and looking up (e.g. Koyfin or Yahoo! Finance) the equity beta for your companies. Create a table summarizing this information for all the companies. covered by your group and include it in the Word document. Dil FR 888 FA 9 8 69 % de 6 & 7 38 - 1 Annual Historical Returns 2 3 ***Change cells in blue 4 5 6 Year 7 2017 2018 8 2019 2020 2021 9 10 11 12 HPR 13 APY 14 15 16 5678 17 18 Google 35.580% -1.030% 29.100% 31.030% 65.170% 274.910% 30 252% G Apple Facebook 24.937% 0.461% 0.000% -2.970% -0.001% 0.000% 19.343% 0.088% 0.000% 24.251% 0.806% 0.000% 36.889% 0.335% 0.000% 146.074% 1.699% 0.000% 19.733% 0.337% 0.000% Oracle H Twitter 0.000% 0.000% 0.000% 0.000% 0.000% 0.000% 0.000% I J Microsoft SPY 0.000% 12.000% 0.000% 21.710% 0.000% 4.570% 0.000% 31.220% 0.000% 18.330% 0.000% 101.987% 0.000% 15.097% K M N O Step by Step Solution
There are 3 Steps involved in it
Step: 1

Get Instant Access to Expert-Tailored Solutions
See step-by-step solutions with expert insights and AI powered tools for academic success
Step: 2

Step: 3

Ace Your Homework with AI
Get the answers you need in no time with our AI-driven, step-by-step assistance
Get Started


