Answered step by step
Verified Expert Solution
Link Copied!

Question

1 Approved Answer

Answer activity 1 and 2 with clear solutions. What's In Activity 1 Consider a population of Senior High School consisting of the values 1, 2,3

Answer activity 1 and 2 with clear solutions.
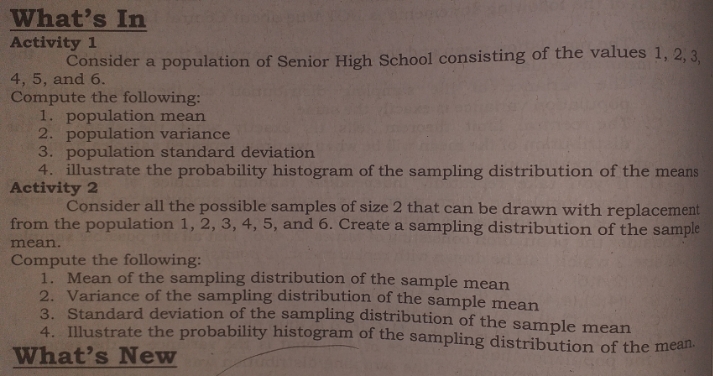
image text in transcribed
What's In Activity 1 Consider a population of Senior High School consisting of the values 1, 2,3 4, 5, and 6. Compute the following: 1. population mean 2. population variance 3. population standard deviation 4. illustrate the probability histogram of the sampling distribution of the means Activity 2 Consider all the possible samples of size 2 that can be drawn with replacement from the population 1, 2, 3, 4, 5, and 6. Create a sampling distribution of the sample mean. Compute the following: 1. Mean of the sampling distribution of the sample mean 2. Variance of the sampling distribution of the sample mean 3. Standard deviation of the sampling distribution of the sample mean 4. Illustrate the probability histogram of the sampling distribution of the mean What's New

Step by Step Solution

There are 3 Steps involved in it

Step: 1

blur-text-image

Get Instant Access to Expert-Tailored Solutions

See step-by-step solutions with expert insights and AI powered tools for academic success

Step: 2

blur-text-image

Step: 3

blur-text-image

Ace Your Homework with AI

Get the answers you need in no time with our AI-driven, step-by-step assistance

Get Started

Recommended Textbook for

Finite Math And Applied Calculus

Authors: Stefan Waner, Steven Costenoble

7th Edition

1337515566, 9781337515566

More Books

Students also viewed these Mathematics questions

Question

What are the main advantages of the gold standard?

Answered: 1 week ago

Question

7. Identify four antecedents that influence intercultural contact.

Answered: 1 week ago

Question

5. Describe the relationship between history and identity.

Answered: 1 week ago