Answered step by step
Verified Expert Solution
Question
1 Approved Answer
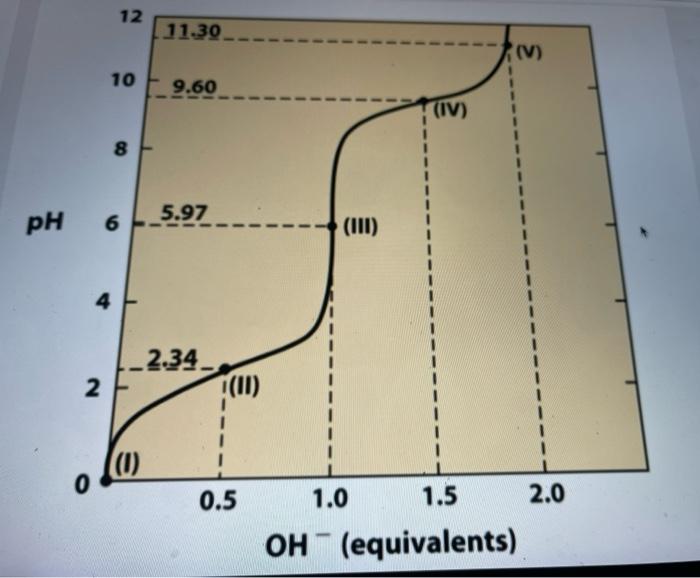
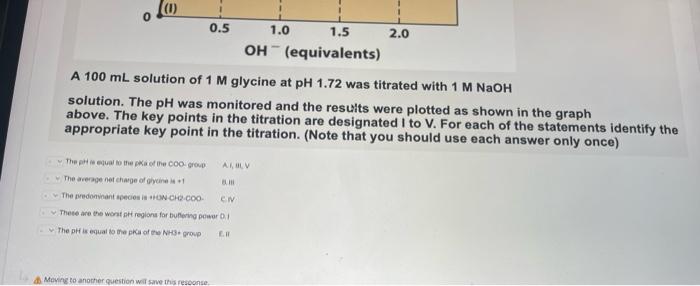
ANSWER FROM GRAPH A 100mL solution of 1M glycine at pH1.72 was titrated with 1MNaOH solution. The pH was monitored and the results were plotted
ANSWER FROM GRAPH 


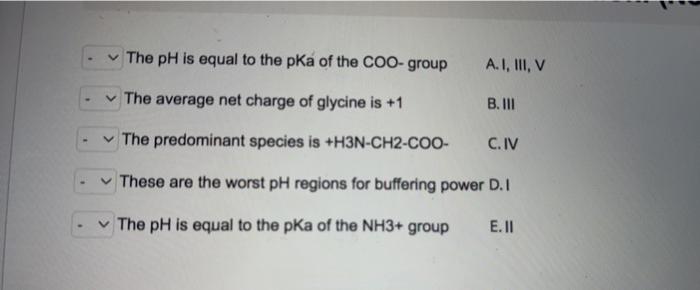
A 100mL solution of 1M glycine at pH1.72 was titrated with 1MNaOH solution. The pH was monitored and the results were plotted as shown in the graph above. The key points in the titration are designated I to V. For each of the statements identify the appropriate key point in the titration. (Note that you should use each answer only once) The arerage net chavge of graine is +1 a Iii. The predonvant apeces is a Thete are the wand ats regions for buflering peitur 0 i the pHi is equal io the pKar of tre NH3- grosp I.II The pH is equal to the pKa of the COO-group A. I, III, V The average net charge of glycine is +1 B. III The predominant species is +H3NCH2COO - C.IV These are the worst pH regions for buffering power D.I The pH is equal to the pKa of the NH3+ group E.II 


Step by Step Solution
There are 3 Steps involved in it
Step: 1

Get Instant Access to Expert-Tailored Solutions
See step-by-step solutions with expert insights and AI powered tools for academic success
Step: 2

Step: 3

Ace Your Homework with AI
Get the answers you need in no time with our AI-driven, step-by-step assistance
Get Started


