Answered step by step
Verified Expert Solution
Question
1 Approved Answer
ANSWER IN MATLAB CODE Generate a real-valued (sampled) sinusoid signal and display as a function of time (in seconds). Compute the DFT of the signal
ANSWER IN MATLAB CODE
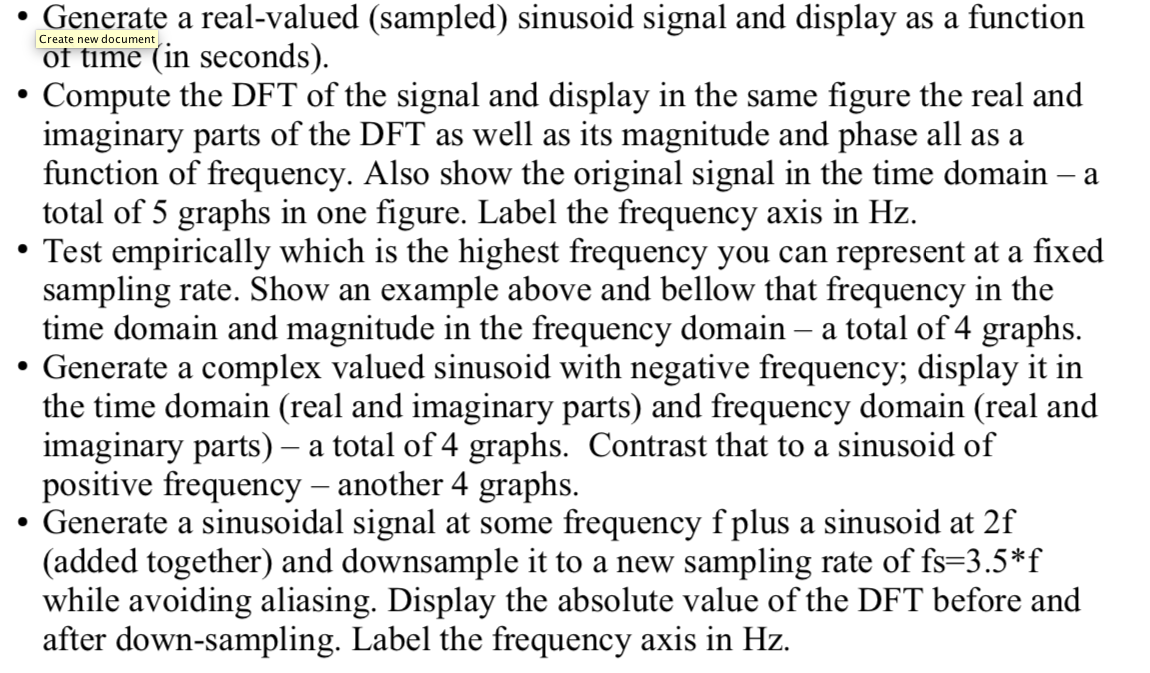
Generate a real-valued (sampled) sinusoid signal and display as a function of time (in seconds). Compute the DFT of the signal and display in the same figure the real and imaginary parts of the DFT as well as its magnitude and phase all as a function of frequency. Also show the original signal in the time domain - a total of 5 graphs in one figure. Label the frequency axis in Hz. Test empirically which is the highest frequency you can represent at a fixed sampling rate. Show an example above and bellow that frequency in the time domain and magnitude in the frequency domain a total of 4 graphs. Generate a complex valued sinusoid with negative frequency; display it in the time domain (real and imaginary parts) and frequency domain (real and imaginary parts) a total of 4 graphs. Contrast that to a sinusoid of positive frequency another 4 graphs. Generate a sinusoidal signal at some frequency f plus a sinusoid at 2f (added together) and downsample it to a new sampling rate of fs=3.5*f while avoiding aliasing. Display the absolute value of the DFT before and after down-sampling. Label the frequency axis in HzStep by Step Solution
There are 3 Steps involved in it
Step: 1
Get Instant Access to Expert-Tailored Solutions
See step-by-step solutions with expert insights and AI powered tools for academic success
Step: 2
Step: 3
Ace Your Homework with AI
Get the answers you need in no time with our AI-driven, step-by-step assistance
Get Started