 Answer is not 0.22 ,15.67 or 16.78!!!


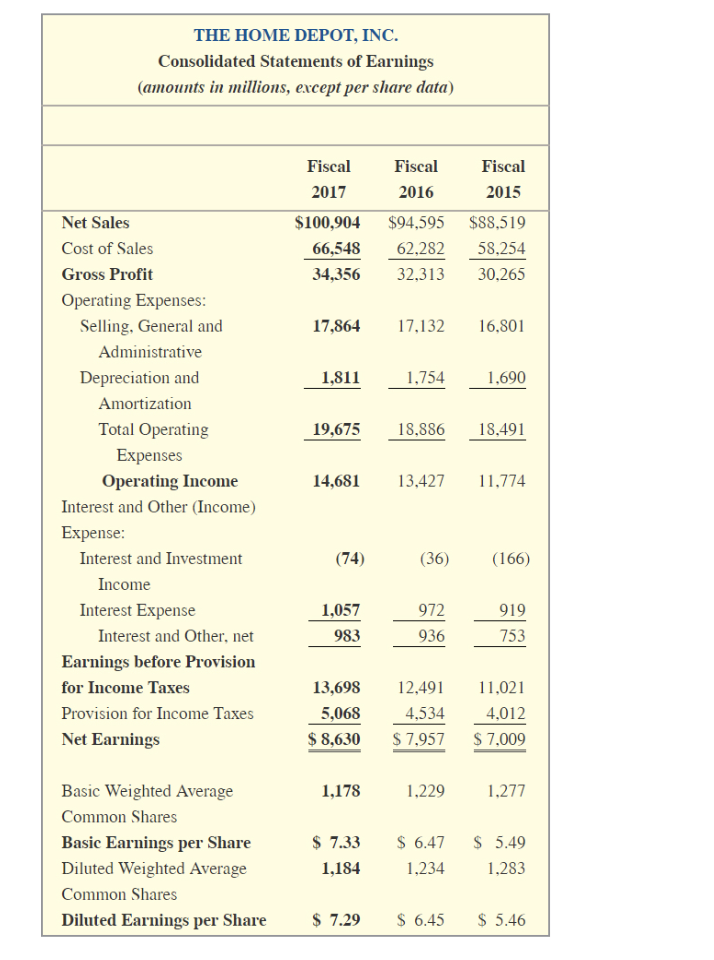
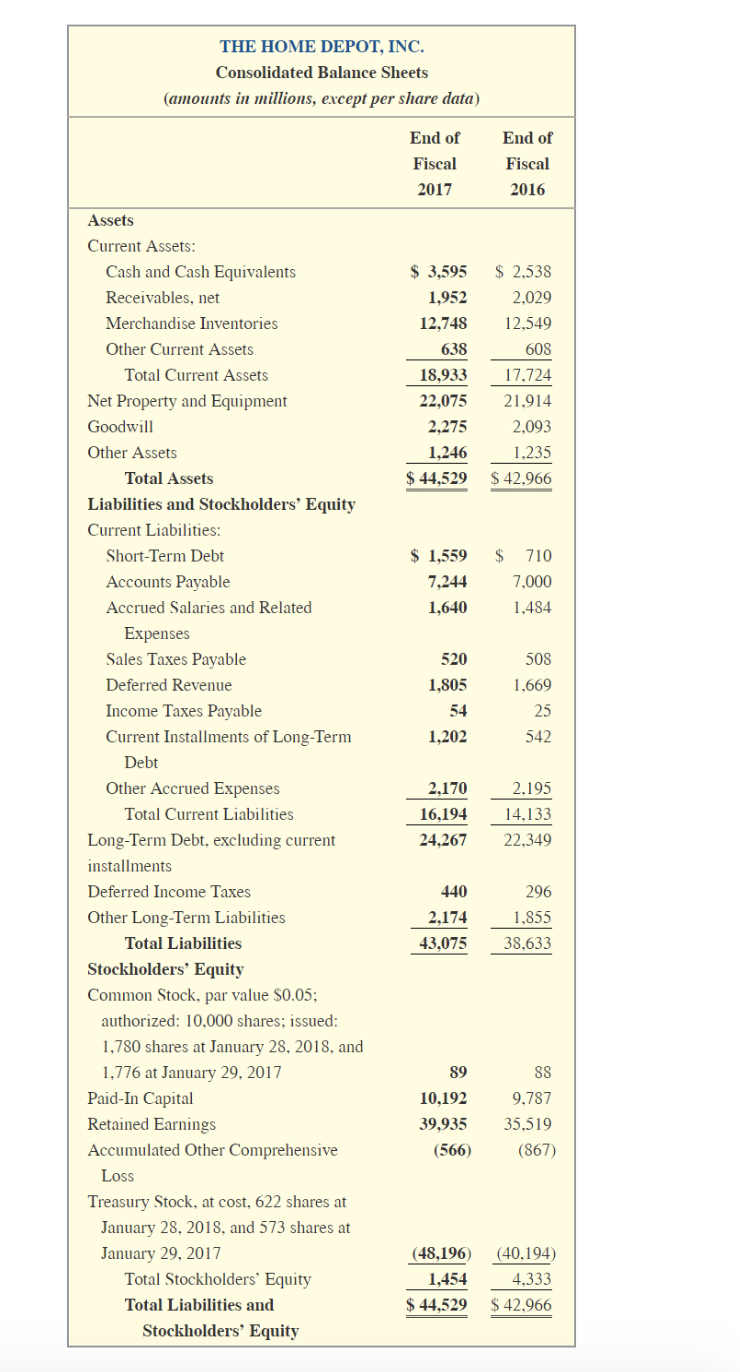
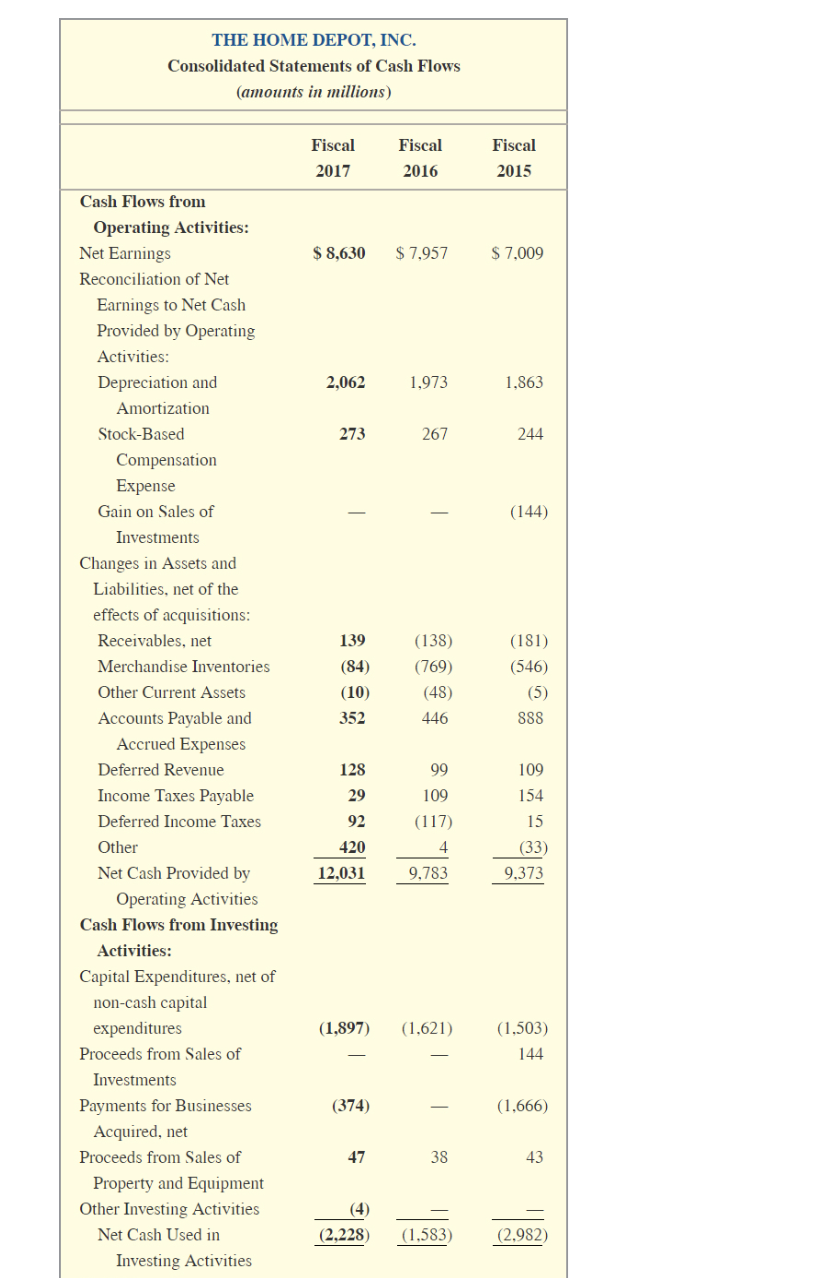
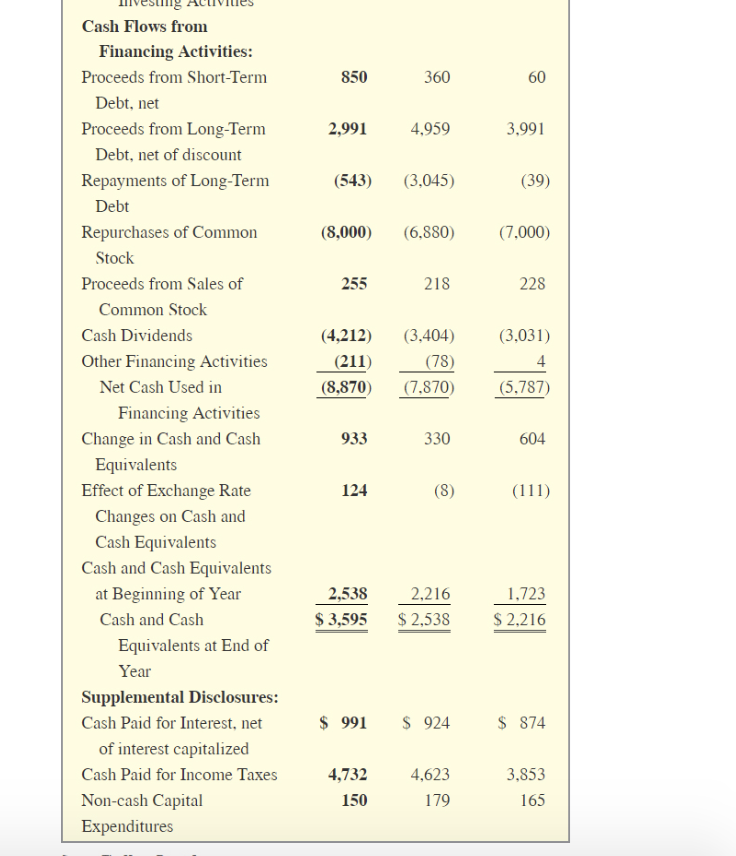
Using the financial information presented in Exhibit 13.1, calculate the following ratios for fiscal 2017 for The Home Depot: (Do not round your intermediate calculations and round your answers to 2 decimal places. Round your percentage answers to 2 decimal places. (i.e., 0.1234 should be entered as 12.34).) Return on equity Return on assets Total asset turnover Inventory turnover Current ratio Quick ratio Cash coverage ratio Debt-to-equity ratio 298.25 % 19.73 % 2.31 5.26 1.17 0.34 29.63 THE HOME DEPOT, INC. Consolidated Statements of Earnings (amounts in millions, except per share data) Fiscal 2017 $100,904 66,548 34,356 Fiscal Fiscal 2016 2015 $94,595 $88,519 62,28258,254 32,313 30,265 17,864 17,132 16.801 1,811 1,754 1,690 19,675 18.886 18.491 Net Sales Cost of Sales Gross Profit Operating Expenses: Selling, General and Administrative Depreciation and Amortization Total Operating Expenses Operating Income Interest and Other (Income) Expense: Interest and Investment Income Interest Expense Interest and Other, net Earnings before Provision for Income Taxes Provision for Income Taxes Net Earnings 14,681 13.427 11.774 (74) (36) (166) 1,057 983 13,698 5,068 $ 8,630 12,491 4,534 $ 7,957 11,021 4,012 $ 7,009 1,178 1,229 1,277 Basic Weighted Average Common Shares Basic Earnings per Share Diluted Weighted Average Common Shares Diluted Earnings per Share $ 7.33 1,184 $ 6.47 1,234 $ 5.49 1.283 $ 7.29 $ 6.45 $ 5.46 THE HOME DEPOT, INC. Consolidated Balance Sheets (amounts in millions, except per share data) End of Fiscal 2017 End of Fiscal 2016 $ 3,595 1,952 12,748 638 18,933 22,075 2,275 1,246 $ 44,529 $ 2,538 2.029 12,549 608 17,724 21.914 2,093 1,235 $ 42,966 $ $ 1,559 7,244 1,640 710 7.000 1,484 Assets Current Assets: Cash and Cash Equivalents Receivables, net Merchandise Inventories Other Current Assets Total Current Assets Net Property and Equipment Goodwill Other Assets Total Assets Liabilities and Stockholders' Equity Current Liabilities: Short-Term Debt Accounts Payable Accrued Salaries and Related Expenses Sales Taxes Payable Deferred Revenue Income Taxes Payable Current Installments of Long-Term Debt Other Accrued Expenses Total Current Liabilities Long-Term Debt, excluding current installments Deferred Income Taxes Other Long-Term Liabilities Total Liabilities Stockholders' Equity Common Stock, par value $0.05; authorized: 10,000 shares; issued: 1,780 shares at January 28, 2018, and 1,776 at January 29, 2017 Paid-In Capital Retained Earnings Accumulated Other Comprehensive 520 1,805 508 1,669 54 1,202 542 2,170 16,194 24,267 2,195 14,133 22,349 440 2,174 43,075 296 1,855 38.633 88 89 10,192 39,935 (566) 9,787 35,519 (867) Loss Treasury Stock, at cost, 622 shares at January 28, 2018, and 573 shares at January 29, 2017 Total Stockholders' Equity Total Liabilities and Stockholders' Equity (48,196) 1,454 $ 44,529 (40,194) 4,333 $ 42,966 THE HOME DEPOT, INC. Consolidated Statements of Cash Flows (amounts in millions) Fiscal 2017 Fiscal 2016 Fiscal 2015 $8,630 $ 7,957 $ 7,009 2,062 1,973 1,863 267 244 (144) 139 (84) (138) (769) (48) 446 (181) (546) (5) 888 (10) 352 Cash Flows from Operating Activities: Net Earnings Reconciliation of Net Earnings to Net Cash Provided by Operating Activities: Depreciation and Amortization Stock-Based Compensation Expense Gain on Sales of Investments Changes in Assets and Liabilities, net of the effects of acquisitions: Receivables, net Merchandise Inventories Other Current Assets Accounts Payable and Accrued Expenses Deferred Revenue Income Taxes Payable Deferred Income Taxes Other Net Cash Provided by Operating Activities Cash Flows from Investing Activities: Capital Expenditures, net of non-cash capital expenditures Proceeds from Sales of Investments Payments for Businesses Acquired, net Proceeds from Sales of Property and Equipment Other Investing Activities Net Cash Used in Investing Activities 109 154 128 29 92 420 12,031 99 109 (117) 4 9,783 9.373 (1,897) (1,621) (1.503) 144 (374) (1.666) - 47 38 (2,228 7.555 (2.982) 850 360 60 2,991 4,959 3.991 (543) (3,045) (39) (8,000) (6,880) (7.000) 255 218 228 (3,031) (4,212) (211) (8.870) (3,404) (78) (7.870 (5,787) Hvestig Helvilles Cash Flows from Financing Activities: Proceeds from Short-Term Debt, net Proceeds from Long-Term Debt, net of discount Repayments of Long-Term Debt Repurchases of Common Stock Proceeds from Sales of Common Stock Cash Dividends Other Financing Activities Net Cash Used in Financing Activities Change in Cash and Cash Equivalents Effect of Exchange Rate Changes on Cash and Cash Equivalents Cash and Cash Equivalents at Beginning of Year Cash and Cash Equivalents at End of Year Supplemental Disclosures: Cash Paid for Interest, net of interest capitalized Cash Paid for Income Taxes Non-cash Capital Expenditures 933 330 604 124 (8) (111) 2,216 1.723 2,538 $ 3,595 $ 2,538 $ 2,216 $ 991 $ 924 $ 874 4,732 4,623 150179 3,853 165
 Answer is not 0.22 ,15.67 or 16.78!!!


