Answered step by step
Verified Expert Solution
Question
1 Approved Answer
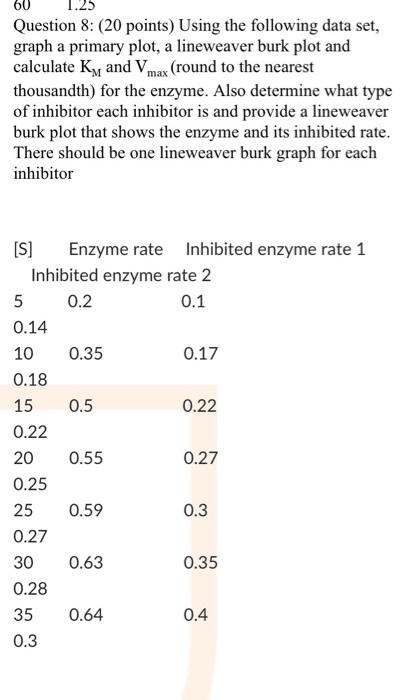
answer please 60 Question 8: (20 points) Using the following data set, graph a primary plot, a lineweaver burk plot and calculate Ky and Vmax
answer please 

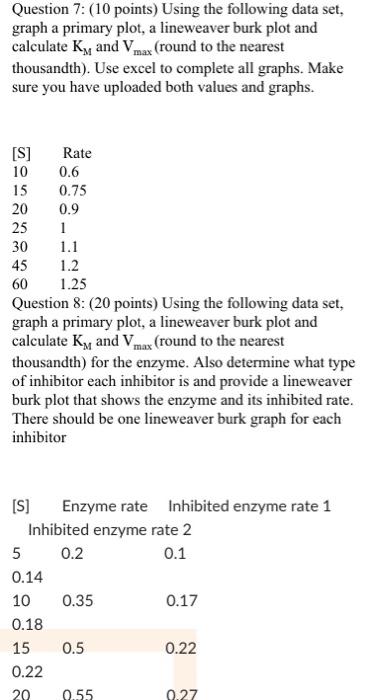
60 Question 8: (20 points) Using the following data set, graph a primary plot, a lineweaver burk plot and calculate Ky and Vmax (round to the nearest thousandth) for the enzyme. Also determine what type of inhibitor each inhibitor is and provide a lineweaver burk plot that shows the enzyme and its inhibited rate. There should be one lineweaver burk graph for each inhibitor [S] Enzyme rate Inhibited enzyme rate 1 Inhibited enzyme rate 2 5 0.2 0.1 0.14 10 0.35 0.17 0.18 15 0.5 0.22 0.22 20 0.55 0.27 0.25 25 0.59 0.3 0.27 30 0.63 0.35 0.28 35 0.64 0.4 0.3 Question 7: (10 points) Using the following data set, graph a primary plot, a lineweaver burk plot and calculate Ky and Vmax (round to the nearest thousandth). Use excel to complete all graphs. Make sure you have uploaded both values and graphs. 0.6 [S] Rate 10 15 0.75 20 0.9 25 1 30 1.1 45 1.2 60 1.25 Question 8: (20 points) Using the following data set, graph a primary plot, a lineweaver burk plot and calculate K, and Vmax (round to the nearest thousandth) for the enzyme. Also determine what type of inhibitor each inhibitor is and provide a lineweaver burk plot that shows the enzyme and its inhibited rate. There should be one lineweaver burk graph for each inhibitor [S] Enzyme rate Inhibited enzyme rate 1 Inhibited enzyme rate 2 5 0.2 0.1 0.14 0.35 0.17 0.18 15 0.5 0.22 0.22 20 0.55 0.27 10 

Step by Step Solution
There are 3 Steps involved in it
Step: 1

Get Instant Access to Expert-Tailored Solutions
See step-by-step solutions with expert insights and AI powered tools for academic success
Step: 2

Step: 3

Ace Your Homework with AI
Get the answers you need in no time with our AI-driven, step-by-step assistance
Get Started


