answer thanks
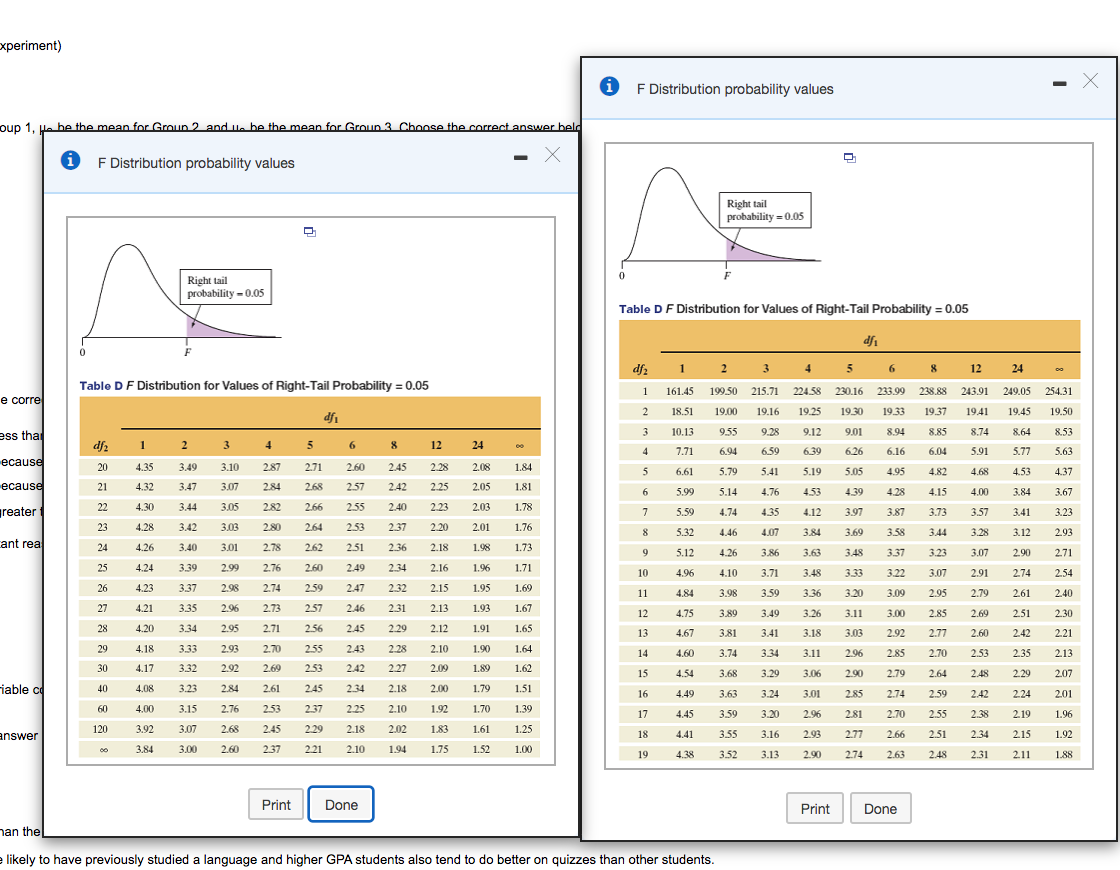
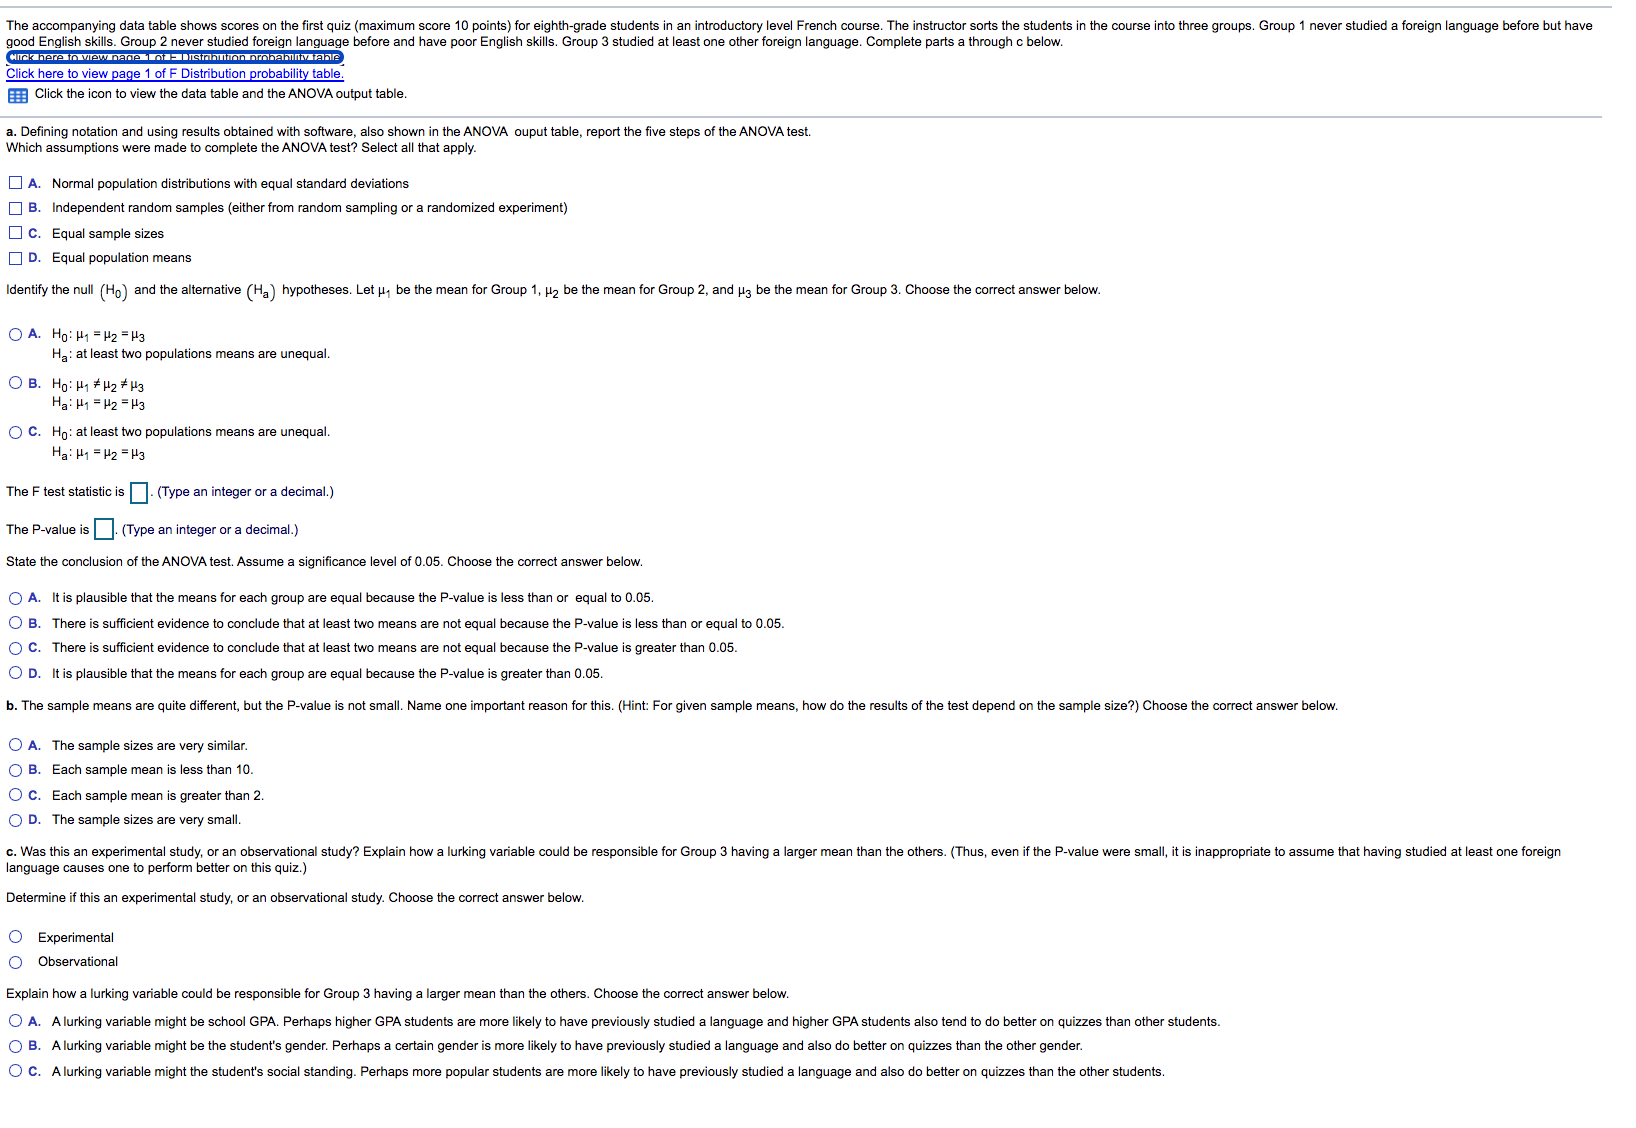
xperiment) - X i F Distribution probability values oup 1, He he the mean for Gmun 2 and i. he the mean for Groun 3_Choose the correct answer held - X i F Distribution probability values Right tail probability = 0.05 Right tail probability = 0.05 Table D F Distribution for Values of Right-Tail Probability = 0.05 24 df2 1 2 3 4 5 6 12 Table D F Distribution for Values of Right-Tail Probability = 0.05 1 161.45 199.50 215.71 224.58 230.16 233.99 238.88 243.91 249.05 254.31 19.45 19.50 2 18.51 19.00 19.16 19.25 19.30 19.33 19.37 19.41 e corre dfi 8.74 8.64 8.53 3 10.13 9.55 9.28 9.12 9.01 8.94 8.85 6.16 6.04 5.91 5.77 5.63 12 6.94 6.50 6.39 6.26 ess that 24 4 7.71 1 2 3 4 5 6 5.41 5.19 505 1 05 1.82 1.68 4.53 4.37 6.61 5.70 ecause 4.35 3.49 3.10 2.87 2.71 2.60 2.45 2.28 2.08 1.84 20 4.15 4.00 3.84 3.67 2.57 5.14 456 2.42 2.25 2.05 1.81 4.76 4.28 ecause 21 4.32 3.47 3.07 2.84 2.68 3.87 3.73 3.57 3.41 3.23 2.66 2.55 2 40 2.23 2.03 1.78 7 5.59 4.74 135 4.12 3.97 22 4.30 3.44 3.05 2.82 3.84 3.44 3.28 3.12 reater 4.46 3.69 3.58 293 5.32 LOT 1.28 3.42 3.03 2.80 2.64 2.53 237 2.20 2.01 1.76 8 23 3.37 173 3.07 290 271 1.73 4.26 3.40 2.78 2 36 2.18 4.26 262 2.51 1.98 5.12 ant rea 24 3.01 3.22 307 2.91 274 254 2.34 2.16 1.96 10 4.10 3.48 2.49 1.71 25 4.24 3.39 2.99 2.76 2.60 3.50 3.36 3.20 3.09 2.95 2.79 2.61 2.40 2.59 2.47 2.32 2.15 1.95 1.69 11 3.98 26 4.27 3.37 2 98 2.74 3.00 2.85 2.69 251 2.30 3.49 3.26 3.11 273 2 57 2.46 2 31 2.13 1.93 1.67 12 1.75 3.89 27 3.35 1.65 4.67 3.81 3.41 3.18 3.03 2.92 2.77 2.60 242 2.21 1.91 13 28 1 20 3.34 2.95 2.71 256 2.45 2.29 2.12 206 2.85 2.70 2.53 2.35 2.13 1.60 3.74 3.11 29 4.18 3.33 2.93 2.70 255 2.43 2.28 2.10 1.90 1.64 14 1.62 3.20 2 90 2.79 2.64 2.48 2.29 207 2.42 2.27 1.54 3.68 4.17 2.53 2.09 1.89 15 30 3.32 2.92 2.69 2.74 2.59 2.42 2.24 201 3.63 3.24 3.01 285 4.08 3.23 2.84 2.61 245 234 2 18 200 1.79 1.51 16 1.49 iable co 1,70 1.39 4.45 3.59 3.20 2.96 2 81 2.70 2.55 2.38 2.19 1.96 1.92 17 60 3.15 2.76 253 237 2.25 2.10 215 3.16 2.77 2.66 251 2.34 1.92 2.68 2.45 2.29 2.18 2.02 1.83 1.61 1.25 18 3.55 120 3.92 3.07 274 2.63 2.48 2.31 211 1.88 inswer 1.00 3.52 3.13 2.90 3.84 3.00 2.60 2.37 2.21 2.10 1.94 1.75 1.52 19 Print Done Print Done an the likely to have previously studied a language and higher GPA students also tend to do better on quizzes than other students.The accompanying data table shows scores on the first quiz (maximum score 10 points) for eighth-grade students in an introductory level French course. The instructor sorts the students in the course into three groups. Group 1 never studied a foreign language before but have good English skills. Group 2 never studied foreign language before and have poor English skills. Group 3 studied at least one other foreign language. Complete parts a through c below Girl! here in view name ) of 2 Dictation Ambamity table Click here to view page 1 of F Distribution probability table. Click the icon to view the data table and the ANOVA output table a. Defining notation and using results obtained with software, also shown in the ANOVA ouput table, report the five steps of the ANOVA test. Which assumptions were made to complete the ANOVA test? Select all that apply. A. Normal population distributions with equal standard deviations B. Independent random samples (either from random sampling or a randomized experiment) O C. Equal sample sizes D. Equal population means Identify the null (Ho) and the alternative (Ha) hypotheses. Let u be the mean for Group 1, H2 be the mean for Group 2, and ly be the mean for Group 3. Choose the correct answer below. O A. Ho: H1 = H2 = H3 Ha: at least two populations means are unequal. O B. Ho: Hq # H2 # H3 Ha: H1 = H2 = H3 O C. Ho: at least two populations means are unequal. Ha: H1 = H2 = H3 The F test statistic is . (Type an integer or a decimal.) The P-value is . (Type an integer or a decimal.) State the conclusion of the ANOVA test. Assume a significance level of 0.05. Choose the correct answer below. O A. It is plausible that the means for each group are equal because the P-value is less than or equal to 0.05. O B. There is sufficient evidence to conclude that at least two means are not equal because the P-value is less than or equal to 0.05. O C. There is sufficient evidence to conclude that at least two means are not equal because the P-value is greater than 0.05. O D. It is plausible that the means for each group are equal because the P-value is greater than 0.05. b. The sample means are quite different, but the P-value is not small. Name one important reason for this. (Hint: For given sample means, how do the results of the test depend on the sample size?) Choose the correct answer below. O A. The sample sizes are very similar. O B. Each sample mean is less than 10. O C. Each sample mean is greater than 2. O D. The sample sizes are very small. c. Was this an experimental study, or an observational study? Explain how a lurking variable could be responsible for Group 3 having a larger mean than the others. (Thus, even if the P-value were small, it is inappropriate to assume that having studied at least one foreign language causes one to perform better on this quiz.) Determine if this an experimental study, or an observational study. Choose the correct answer below. O Experimental Observational Explain how a lurking variable could be responsible for Group 3 having a larger mean than the others. Choose the correct answer below. O A. A lurking variable might be school GPA. Perhaps higher GPA students are more likely to have previously studied a language and higher GPA students also tend to do better on quizzes than other students. O B. A lurking variable might be the student's gender. Perhaps a certain gender is more likely to have previously studied a language and also do better on quizzes than the other gender. O C. A lurking variable might the student's social standing. Perhaps more popular students are more likely to have previously studied a language and also do better on quizzes than the other students