Answered step by step
Verified Expert Solution
Question
1 Approved Answer
answer the following question 3 in second picture using data from first picture - Seved to this view View ROM ABC Datotebal Albacete natbeeldt AaBbced
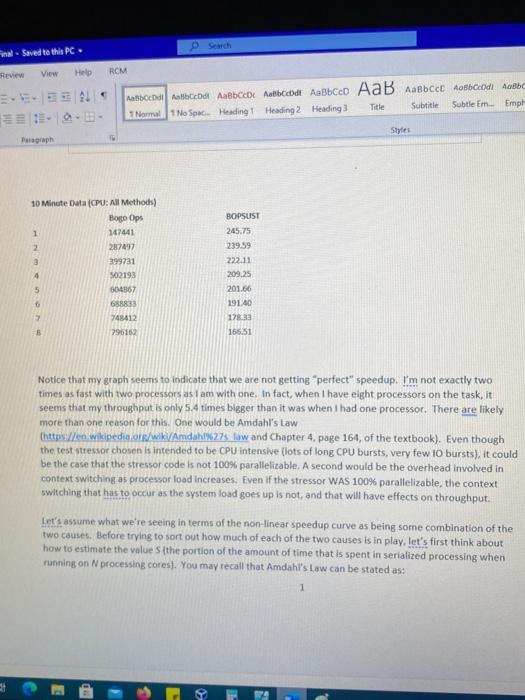
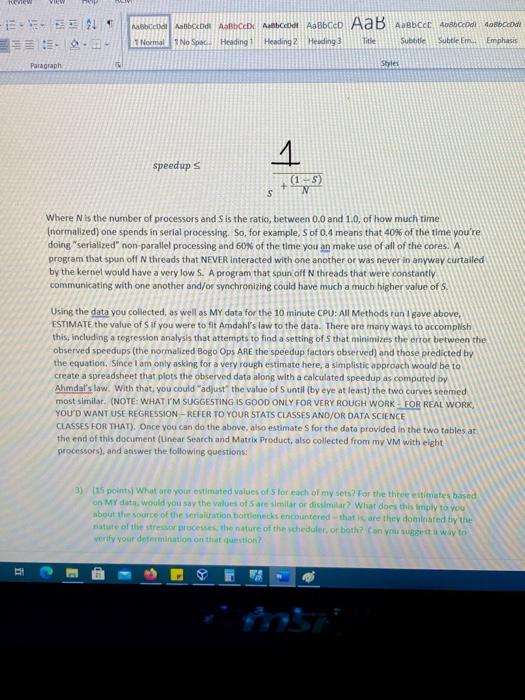
answer the following question 3 in second picture using data from first picture 

- Seved to this view View ROM ABC Datotebal Albacete natbeeldt AaBbced AaB AaBbcchobocodi domba Normal No Space Heading 1 Heading 2 Heading Subtitle Subtle Em. Emph Title Style: Pragraph 30 Minute Data (CPU: All Methods) Bogo Ops 1 142441 2 287497 399731 4 BOPSUST 245.75 239.59 222.11 209.25 201.66 19140 178.33 166.51 502193 504867 688833 248412 296150 0 Notice that my graph seems to indicate that we are not getting "perfect" speedup. I'm not exactly two times as fast with two processors as I am with one. In fact, when I have eight processors on the task, it seems that my throughput is only 5.4 times bigger than it was when I had one processor. There are likely more than one reason for this. One would be Amdahl's Law thttps://en.wikipedia.or/wiki/Amdahl%27s law and Chapter 4. page 164, of the textbook). Even though the test stressor chosen is intended to be CPU intensive lots of long CPU bursts, very few 10 bursts), it could be the case that the stressor code is not 100% parallelizable. A second would be the overhead involved in context switching as processor load increases. Even if the stressor WAS 100% parallelizable, the context switching that has to occur as the system load goes up is not, and that will have effects on throughput. Let's assume what we're seeing in terms of the non-linear speedup curve as being some combination of the two causes. Before trying to sort out how much of each of the two causes is in play, let's first think about how to estimate the values the portion of the amount of time that is spent in serialized processing when running on N processing cores). You may recall that Amdahl's Law can be stated as: teve -- 1 Normal No Space Heading Heading 2 Heading 3 Title Subtitle Subtle Em Emphasis Paragraph Style speedups (15) N s Where N is the number of processors and S is the ratio, between 0.0 and 1.0, of how much time (normalized) one spends in serial processing. So, for example, S of 0.4 means that 40% of the time you're doing " serialized" non parallel processing and 60% of the time you an make use of all of the cores. A program that spun off N threads that NEVER interacted with one another or was never in anyway curtailed by the kernel would have a very low S. A program that spun oft N threads that were constantly communicating with one another and/or synchronizing could have much a much higher value of S. Using the data you collected, as well as My data for the 10 minute CPU: All Methods run i gave above, ESTIMATE the value of Sif you were to fit Amdahl's law to the data. There are many ways to accomplish this, including a regression analysis that attempts to find a setting of that minimizes the error between the observed speedups (the normalized Bogo Ops ARE the speedup factors observed) and those predicted by the equation. Since I am only asking for a very rough estimate here, a simplistic approach would be to create a spreadsheet that plots the observed data along with a calculated speedup as computed by Ahmdal's law. With that, you could adjust the value of Suntil (by eye at least the two curves seemed most similar. (NOTE: WHAT I'M SUGGESTING IS GOOD ONLY FOR VERY ROUGH WORK - FOR REAL WORK YOU'D WANT USE REGRESSION-REFER TO YOUR STATS CLASSES AND/OR DATA SCIENCE CLASSES FOR THAT). Once you can do the above, also estimate Sfor the data provided in the two tables at the end of this document (Unear Search and Matrix Product, also collected from my VM with eight processors), and answer the following questions: 3) 115 points) What are your estimated values of stor each of my sets? For the three estimates based on My data, would you say the values of sare similar or dicimilar? What does this imply to you about the source of the serialuration bottlenecks encountered that is are they dominated by the nature of the stress esses the nature of the scheduler, or both? Can you suggest a way to orify your determination on the question? i - Seved to this view View ROM ABC Datotebal Albacete natbeeldt AaBbced AaB AaBbcchobocodi domba Normal No Space Heading 1 Heading 2 Heading Subtitle Subtle Em. Emph Title Style: Pragraph 30 Minute Data (CPU: All Methods) Bogo Ops 1 142441 2 287497 399731 4 BOPSUST 245.75 239.59 222.11 209.25 201.66 19140 178.33 166.51 502193 504867 688833 248412 296150 0 Notice that my graph seems to indicate that we are not getting "perfect" speedup. I'm not exactly two times as fast with two processors as I am with one. In fact, when I have eight processors on the task, it seems that my throughput is only 5.4 times bigger than it was when I had one processor. There are likely more than one reason for this. One would be Amdahl's Law thttps://en.wikipedia.or/wiki/Amdahl%27s law and Chapter 4. page 164, of the textbook). Even though the test stressor chosen is intended to be CPU intensive lots of long CPU bursts, very few 10 bursts), it could be the case that the stressor code is not 100% parallelizable. A second would be the overhead involved in context switching as processor load increases. Even if the stressor WAS 100% parallelizable, the context switching that has to occur as the system load goes up is not, and that will have effects on throughput. Let's assume what we're seeing in terms of the non-linear speedup curve as being some combination of the two causes. Before trying to sort out how much of each of the two causes is in play, let's first think about how to estimate the values the portion of the amount of time that is spent in serialized processing when running on N processing cores). You may recall that Amdahl's Law can be stated as: teve -- 1 Normal No Space Heading Heading 2 Heading 3 Title Subtitle Subtle Em Emphasis Paragraph Style speedups (15) N s Where N is the number of processors and S is the ratio, between 0.0 and 1.0, of how much time (normalized) one spends in serial processing. So, for example, S of 0.4 means that 40% of the time you're doing " serialized" non parallel processing and 60% of the time you an make use of all of the cores. A program that spun off N threads that NEVER interacted with one another or was never in anyway curtailed by the kernel would have a very low S. A program that spun oft N threads that were constantly communicating with one another and/or synchronizing could have much a much higher value of S. Using the data you collected, as well as My data for the 10 minute CPU: All Methods run i gave above, ESTIMATE the value of Sif you were to fit Amdahl's law to the data. There are many ways to accomplish this, including a regression analysis that attempts to find a setting of that minimizes the error between the observed speedups (the normalized Bogo Ops ARE the speedup factors observed) and those predicted by the equation. Since I am only asking for a very rough estimate here, a simplistic approach would be to create a spreadsheet that plots the observed data along with a calculated speedup as computed by Ahmdal's law. With that, you could adjust the value of Suntil (by eye at least the two curves seemed most similar. (NOTE: WHAT I'M SUGGESTING IS GOOD ONLY FOR VERY ROUGH WORK - FOR REAL WORK YOU'D WANT USE REGRESSION-REFER TO YOUR STATS CLASSES AND/OR DATA SCIENCE CLASSES FOR THAT). Once you can do the above, also estimate Sfor the data provided in the two tables at the end of this document (Unear Search and Matrix Product, also collected from my VM with eight processors), and answer the following questions: 3) 115 points) What are your estimated values of stor each of my sets? For the three estimates based on My data, would you say the values of sare similar or dicimilar? What does this imply to you about the source of the serialuration bottlenecks encountered that is are they dominated by the nature of the stress esses the nature of the scheduler, or both? Can you suggest a way to orify your determination on the 

Step by Step Solution
There are 3 Steps involved in it
Step: 1

Get Instant Access to Expert-Tailored Solutions
See step-by-step solutions with expert insights and AI powered tools for academic success
Step: 2

Step: 3

Ace Your Homework with AI
Get the answers you need in no time with our AI-driven, step-by-step assistance
Get Started


