Answered step by step
Verified Expert Solution
Question
1 Approved Answer
Answer the following questions for this scenario: Five people watched episodes of SpongeBob, The Office, and The Big Bang Theory and rated how funny each
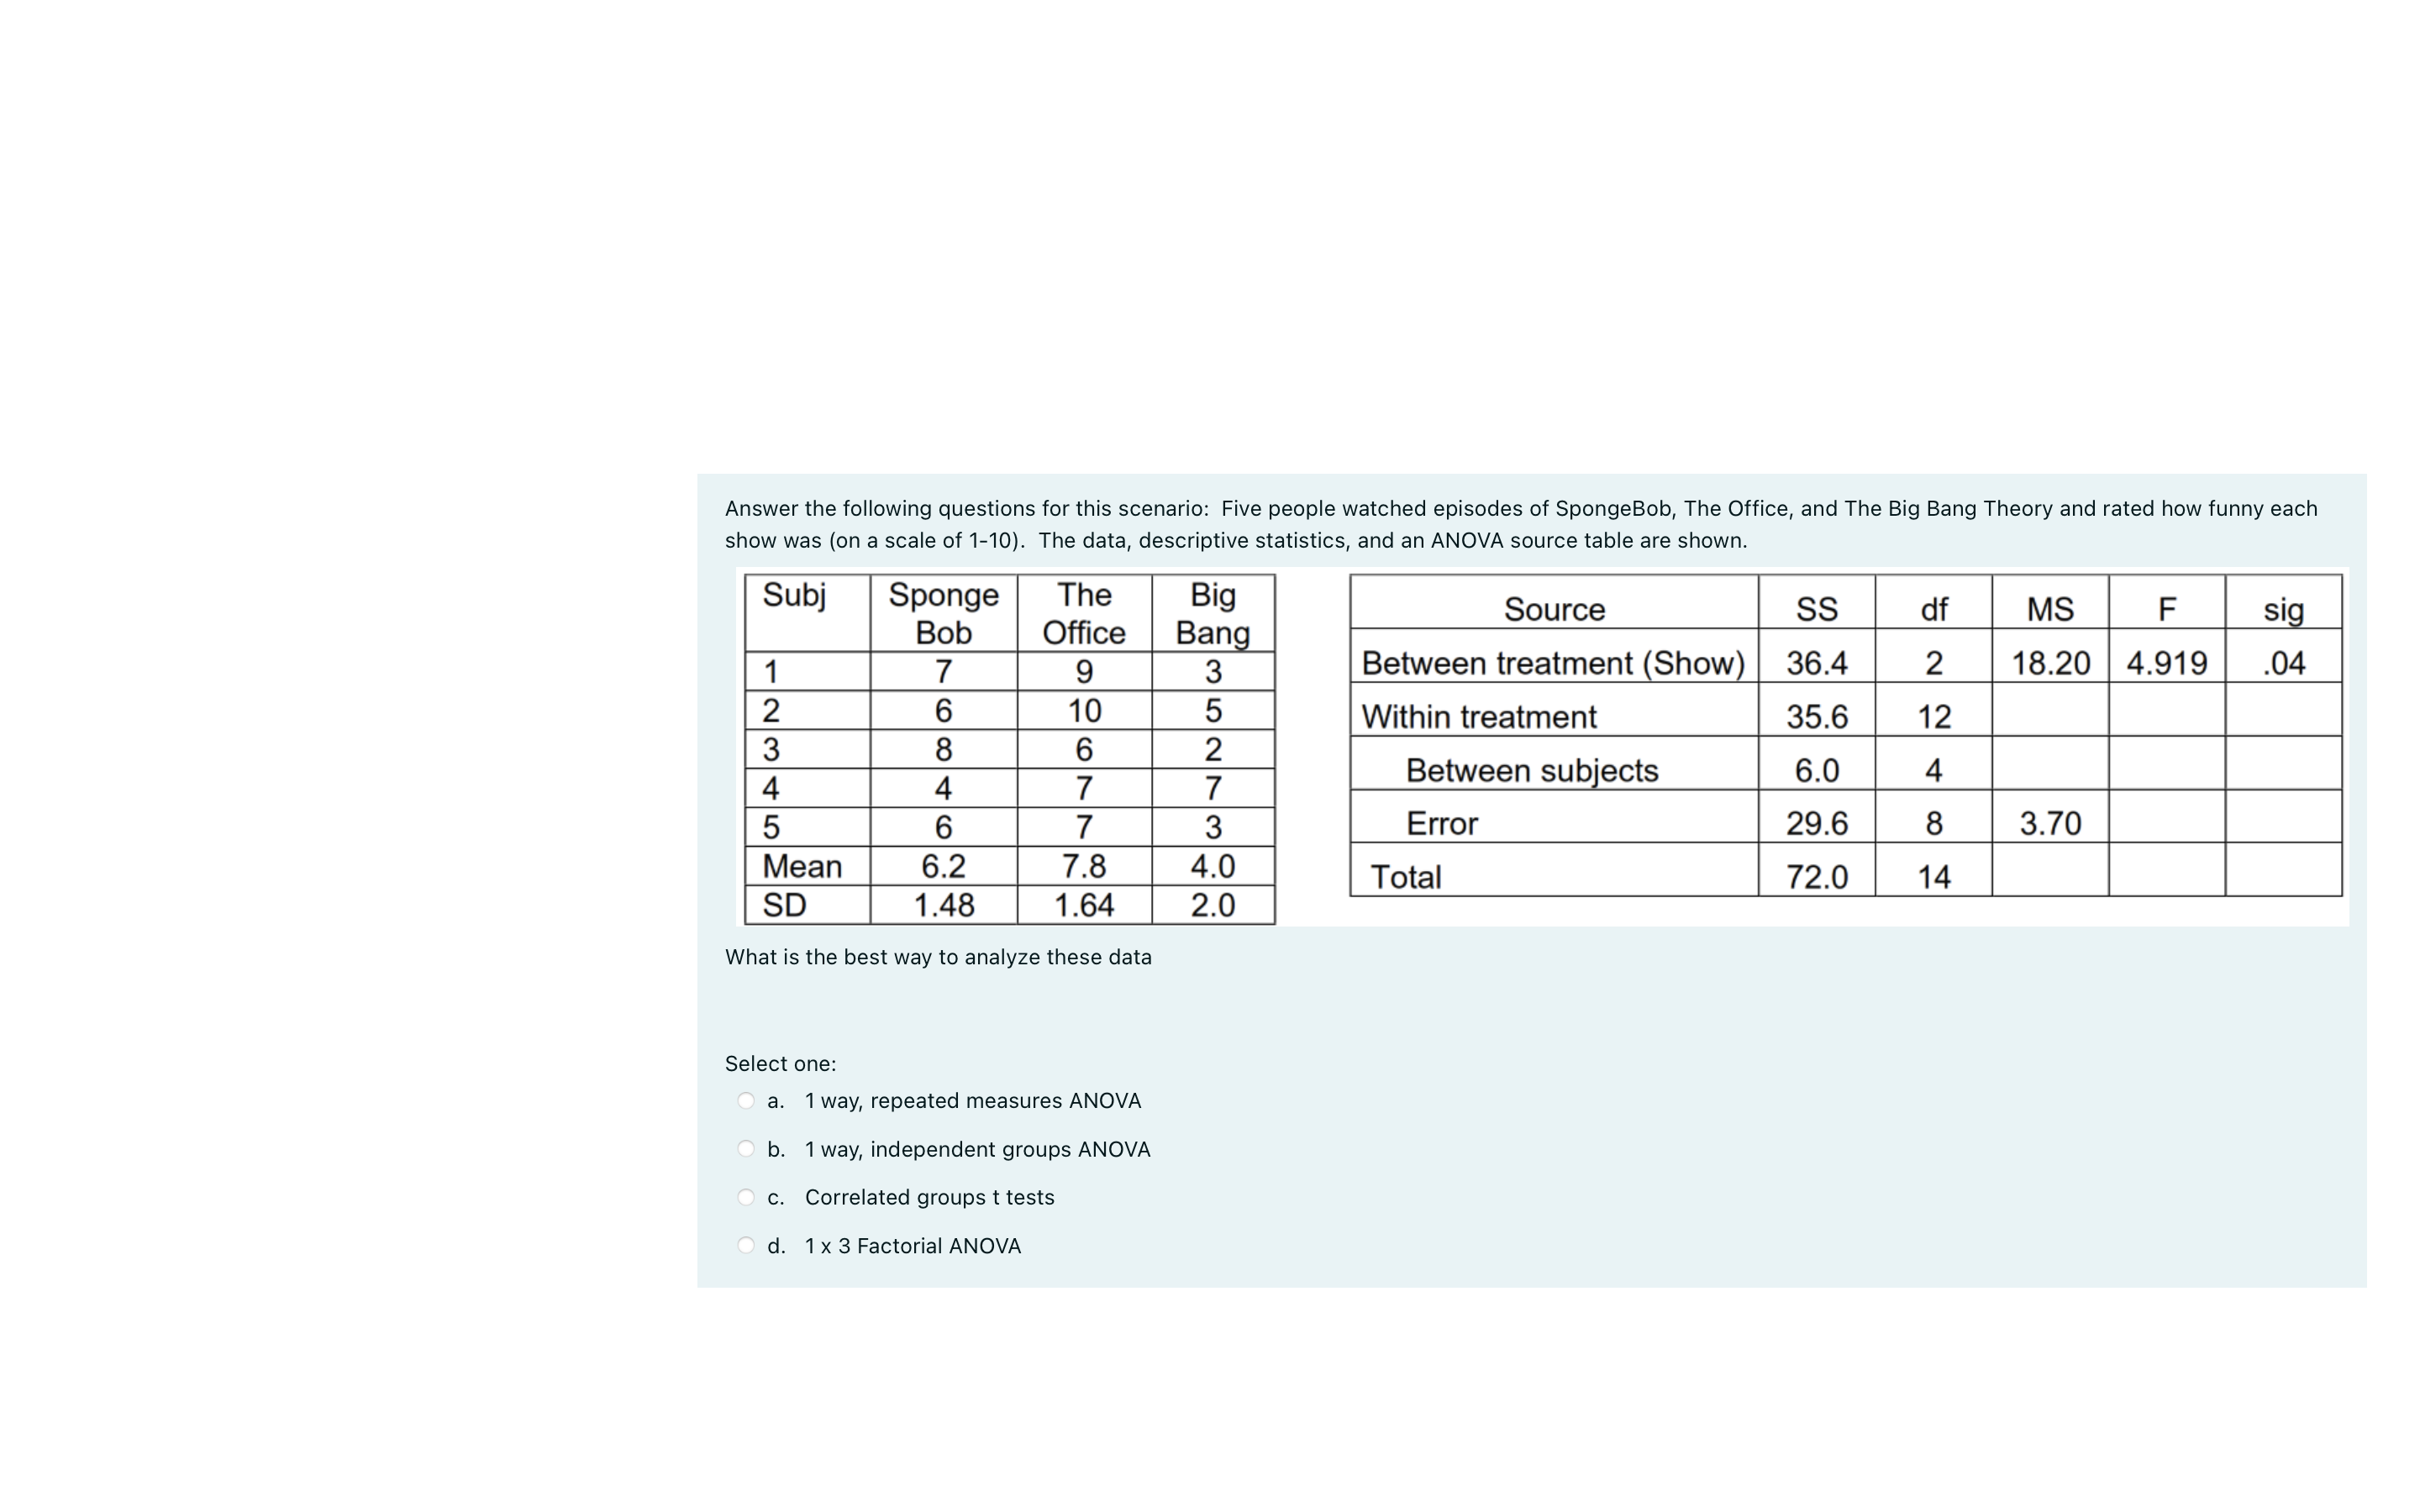
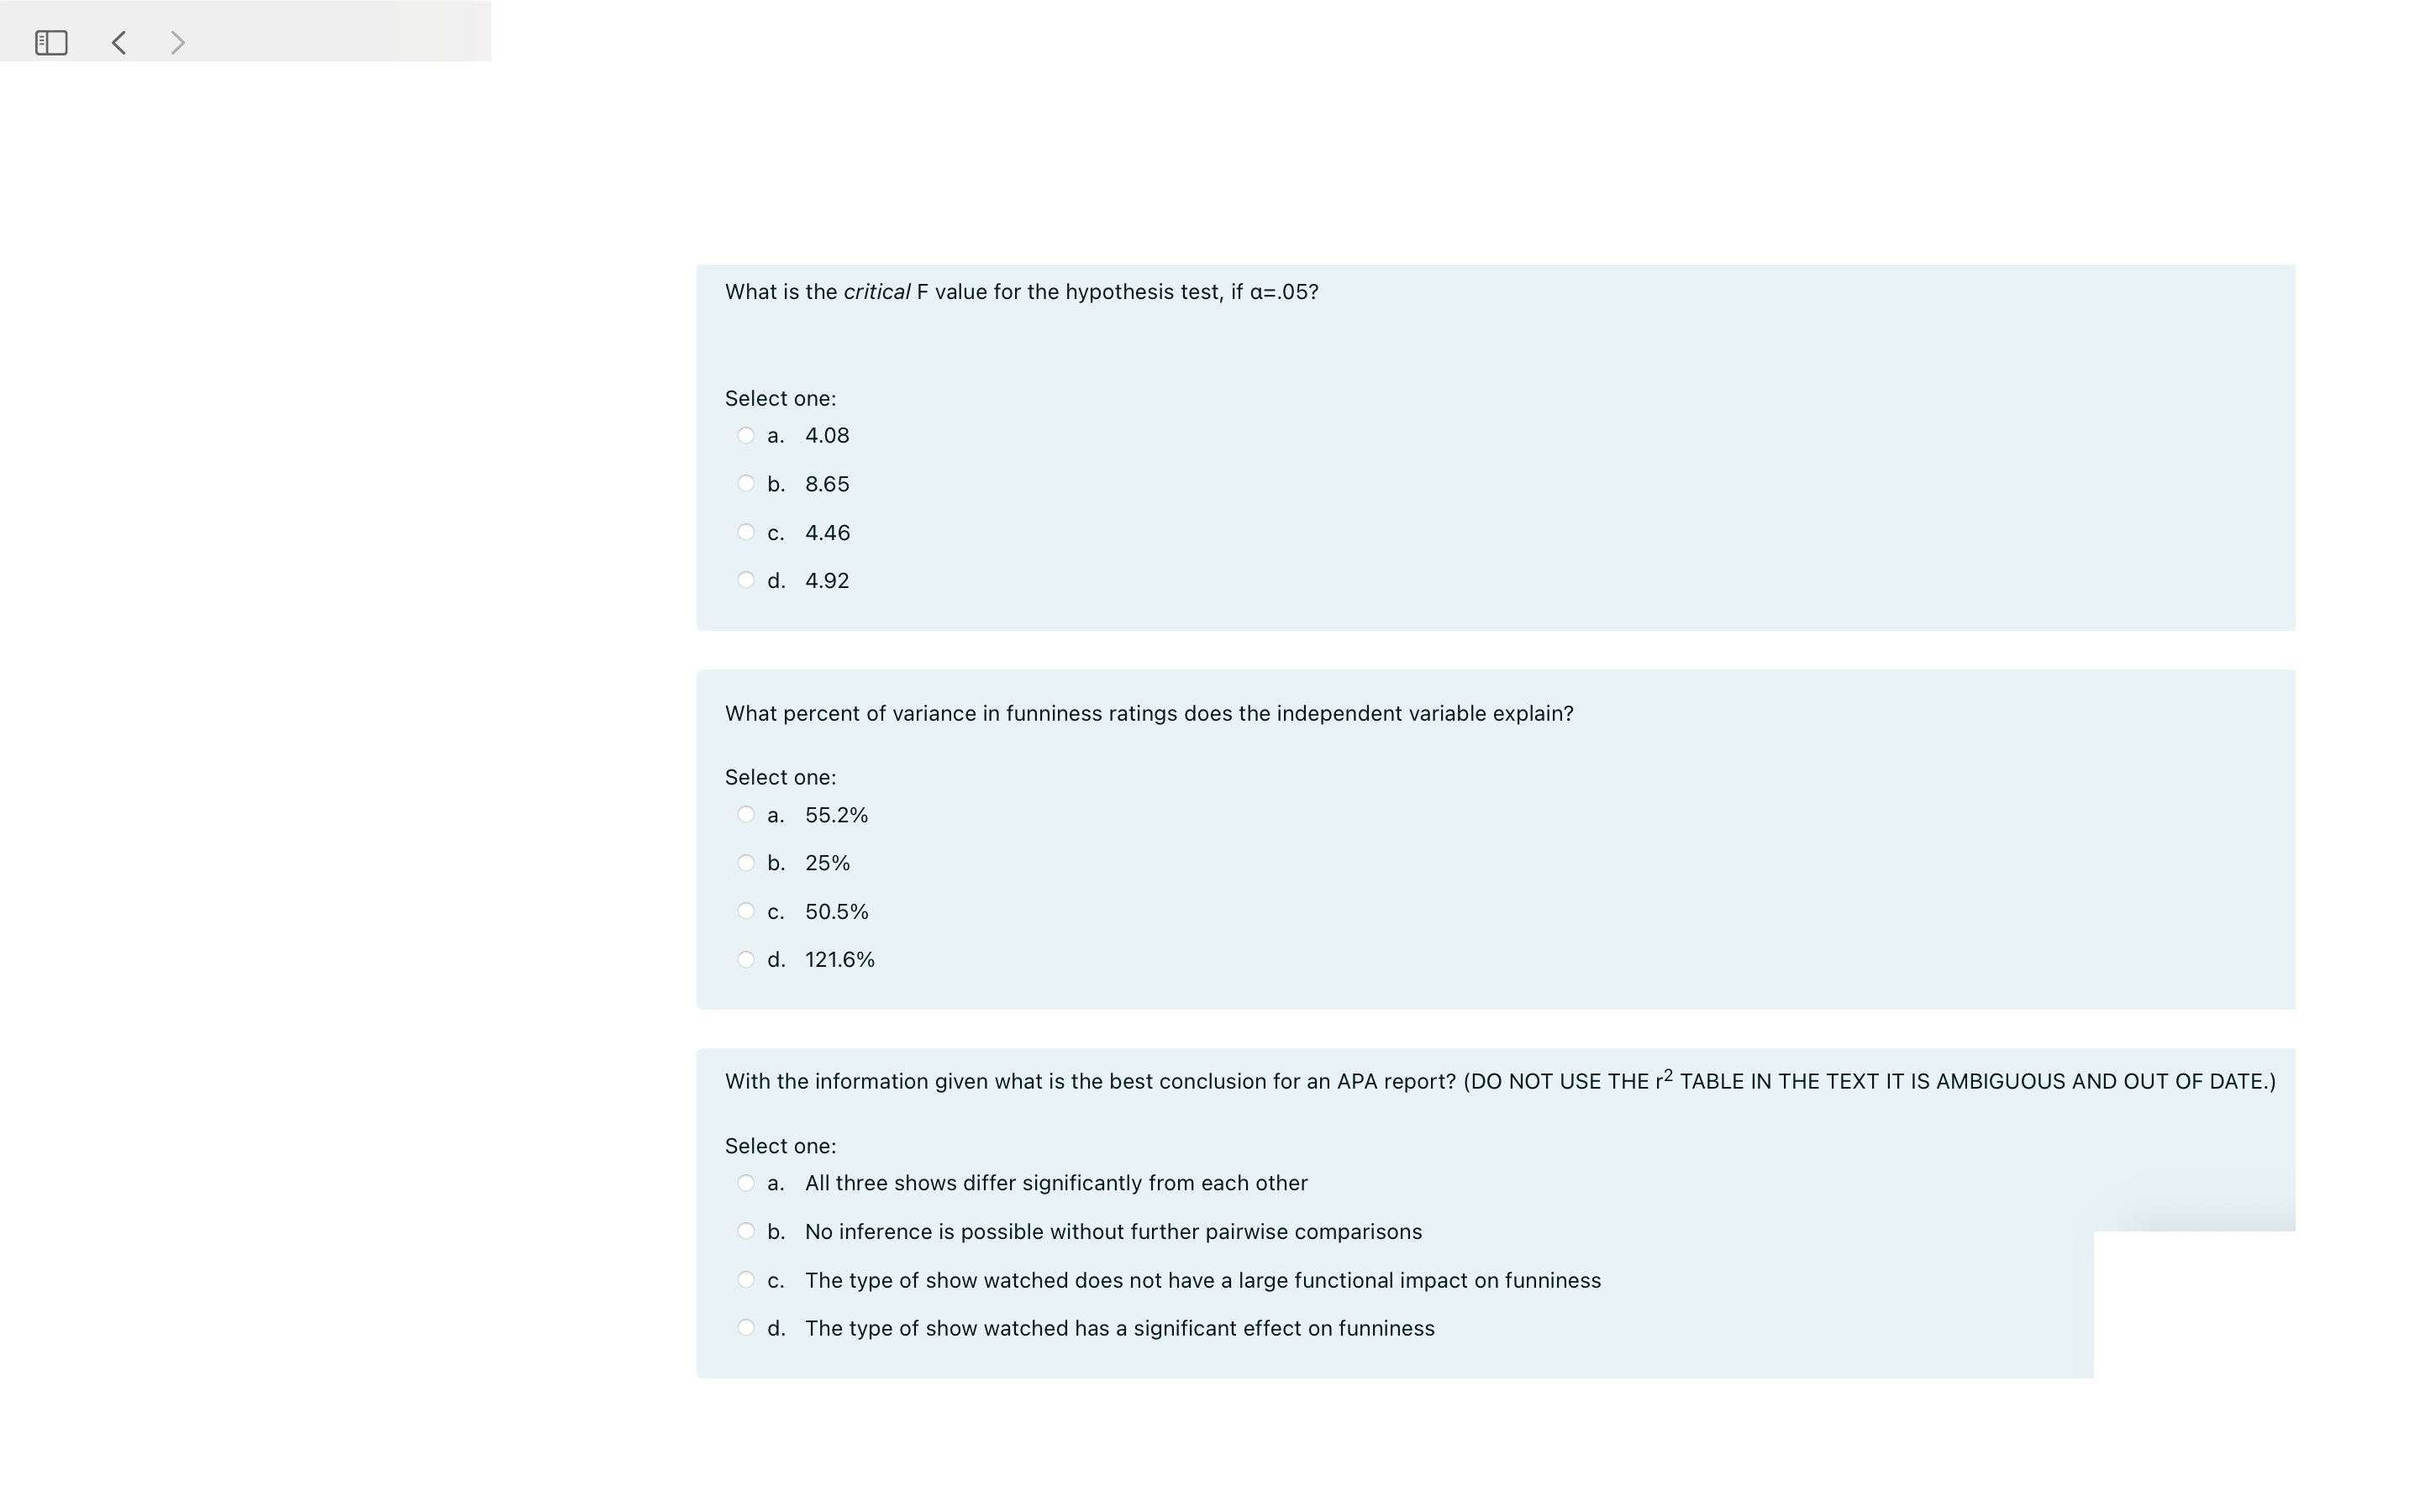
Answer the following questions for this scenario: Five people watched episodes of SpongeBob, The Office, and The Big Bang Theory and rated how funny each show was (on a scale of 110). The data, descriptive statistics, and an ANOVA source table are shown. What is the best way to analyze these data Select one: a. 1 way, repeated measures ANOVA b. 1 way, independent groups ANOVA ' c. Correlated groups t tests ' do 1 x 3 Factorial ANOVA Source Between treatment (Show) Within treatment Between sub'ects Error Total What is the critical F value for the hypothesis test, if a=.05? Select one: a. 4.08 O b. 8.65 O C. 4.46 O d. 4.92 What percent of variance in funniness ratings does the independent variable explain? Select one: a. 55.2% O b. 25% c. 50.5% O d. 121.6% With the information given what is the best conclusion for an APA report? (DO NOT USE THE r2 TABLE IN THE TEXT IT IS AMBIGUOUS AND OUT OF DATE.) Select one: O a. All three shows differ significantly from each other O b. No inference is possible without further pairwise comparisons O c. The type of show watched does not have a large functional impact on funniness O d. The type of show watched has a significant effect on funniness
Step by Step Solution
There are 3 Steps involved in it
Step: 1
Get Instant Access to Expert-Tailored Solutions
See step-by-step solutions with expert insights and AI powered tools for academic success
Step: 2
Step: 3
Ace Your Homework with AI
Get the answers you need in no time with our AI-driven, step-by-step assistance
Get Started