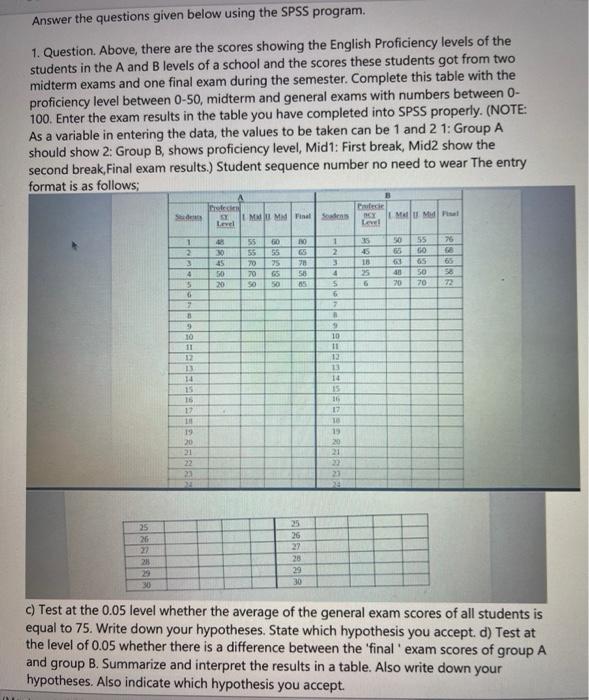
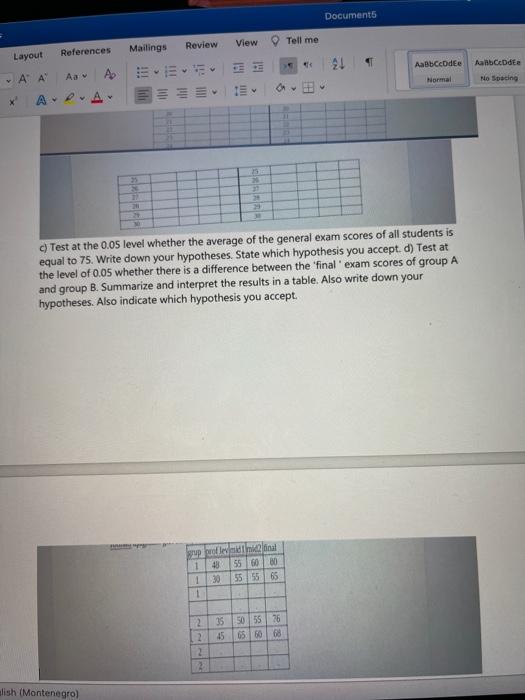
Answer the questions given below using the SPSS program. 1. Question. Above, there are the scores showing the English Proficiency levels of the students in the A and B levels of a school and the scores these students got from two midterm exams and one final exam during the semester. Complete this table with the proficiency level between 0-50, midterm and general exams with numbers between 0- 100. Enter the exam results in the table you have completed into SPSS properly. (NOTE: As a variable in entering the data, the values to be taken can be 1 and 2 1: Group A should show 2: Group B, shows proficiency level, Mid1: First break, Mid2 show the second break, Final exam results.) Student sequence number no need to wear the entry format is as follows: S sed MUU Minta Level MY MUM L! NO 75 1 2 3 4 50 65 55 55 70 70 SO 1 2 3 30 45 50 20 b| Sabse 35 45 18 35 7 56 5 55 GO OS 50 70 4 5 6. 4 20 G 9 10 B 9 10 11 12 13 14 15 16 17 13 13 = CERRA 15 16 17 18 13 20 21 19 20 21 22 22 23 2 25 26 27 21 29 30 35 26 27 28 29 30 c) Test at the 0.05 level whether the average of the general exam scores of all students is equal to 75. Write down your hypotheses. State which hypothesis you accept. d) Test at the level of 0.05 whether there is a difference between the final exam scores of group A and group B. Summarize and interpret the results in a table. Also write down your hypotheses. Also indicate which hypothesis you accept. Documents Review View Tell me Mailings Layout References 21 Abcdee ABCcode Normal ' Aa No Spacing Test at the 0.05 level whether the average of the general exam scores of all students is equal to 75. Write down your hypotheses. State which hypothesis you accept. d) Test at the level of 0.05 whether there is a difference between the final exam scores of group A and group B. Summarize and interpret the results in a table. Also write down your hypotheses. Also indicate which hypothesis you accept. philina 1 40 55 GO 30 55 55 65 1 35 50 55 76 45 65 66 68 2 2 2 2 alish (Montenegro) Answer the questions given below using the SPSS program. 1. Question. Above, there are the scores showing the English Proficiency levels of the students in the A and B levels of a school and the scores these students got from two midterm exams and one final exam during the semester. Complete this table with the proficiency level between 0-50, midterm and general exams with numbers between 0- 100. Enter the exam results in the table you have completed into SPSS properly. (NOTE: As a variable in entering the data, the values to be taken can be 1 and 2 1: Group A should show 2: Group B, shows proficiency level, Mid1: First break, Mid2 show the second break, Final exam results.) Student sequence number no need to wear the entry format is as follows: S sed MUU Minta Level MY MUM L! NO 75 1 2 3 4 50 65 55 55 70 70 SO 1 2 3 30 45 50 20 b| Sabse 35 45 18 35 7 56 5 55 GO OS 50 70 4 5 6. 4 20 G 9 10 B 9 10 11 12 13 14 15 16 17 13 13 = CERRA 15 16 17 18 13 20 21 19 20 21 22 22 23 2 25 26 27 21 29 30 35 26 27 28 29 30 c) Test at the 0.05 level whether the average of the general exam scores of all students is equal to 75. Write down your hypotheses. State which hypothesis you accept. d) Test at the level of 0.05 whether there is a difference between the final exam scores of group A and group B. Summarize and interpret the results in a table. Also write down your hypotheses. Also indicate which hypothesis you accept. Documents Review View Tell me Mailings Layout References 21 Abcdee ABCcode Normal ' Aa No Spacing Test at the 0.05 level whether the average of the general exam scores of all students is equal to 75. Write down your hypotheses. State which hypothesis you accept. d) Test at the level of 0.05 whether there is a difference between the final exam scores of group A and group B. Summarize and interpret the results in a table. Also write down your hypotheses. Also indicate which hypothesis you accept. philina 1 40 55 GO 30 55 55 65 1 35 50 55 76 45 65 66 68 2 2 2 2 alish (Montenegro)


