Answer these
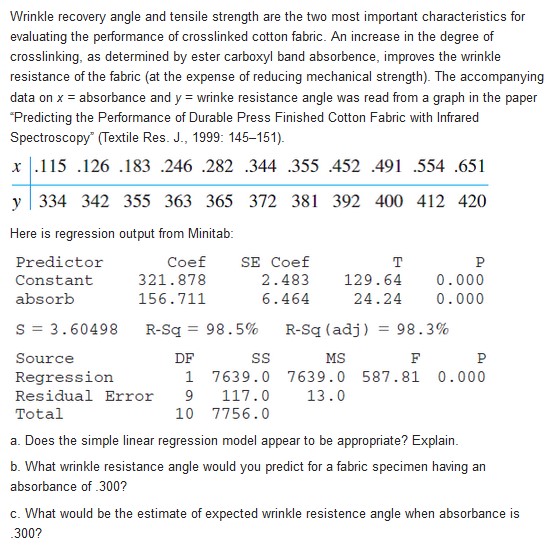
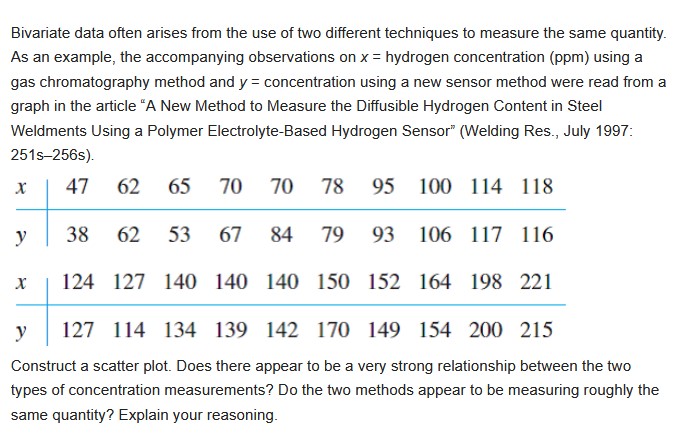
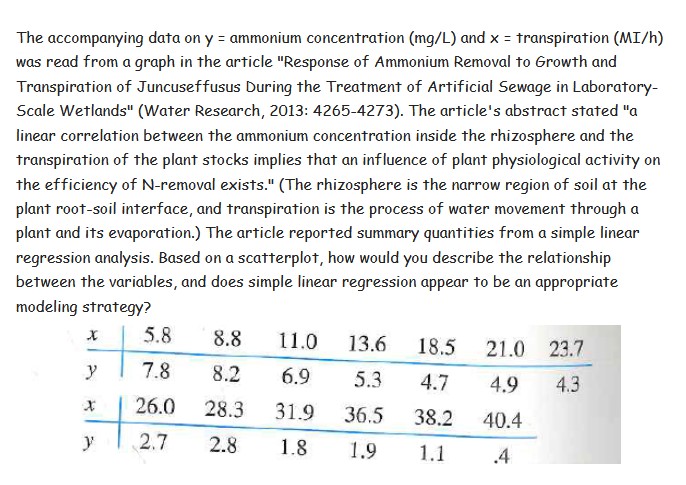
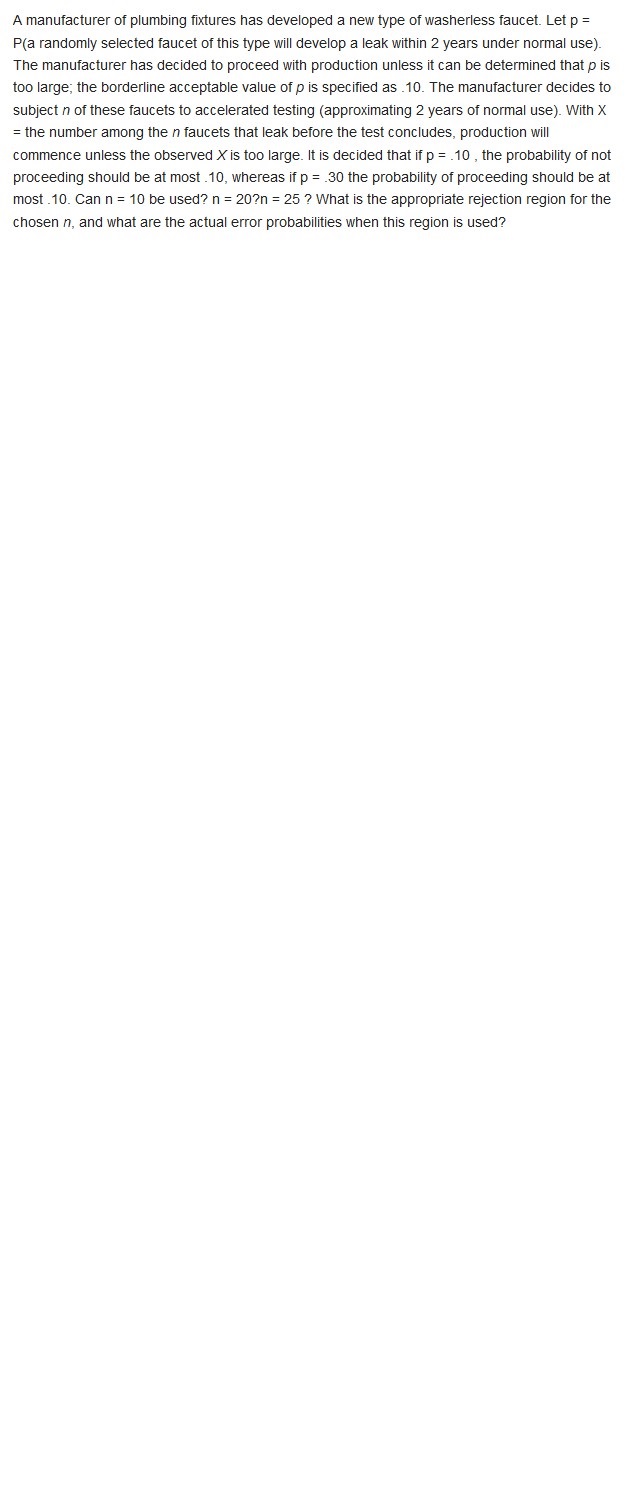
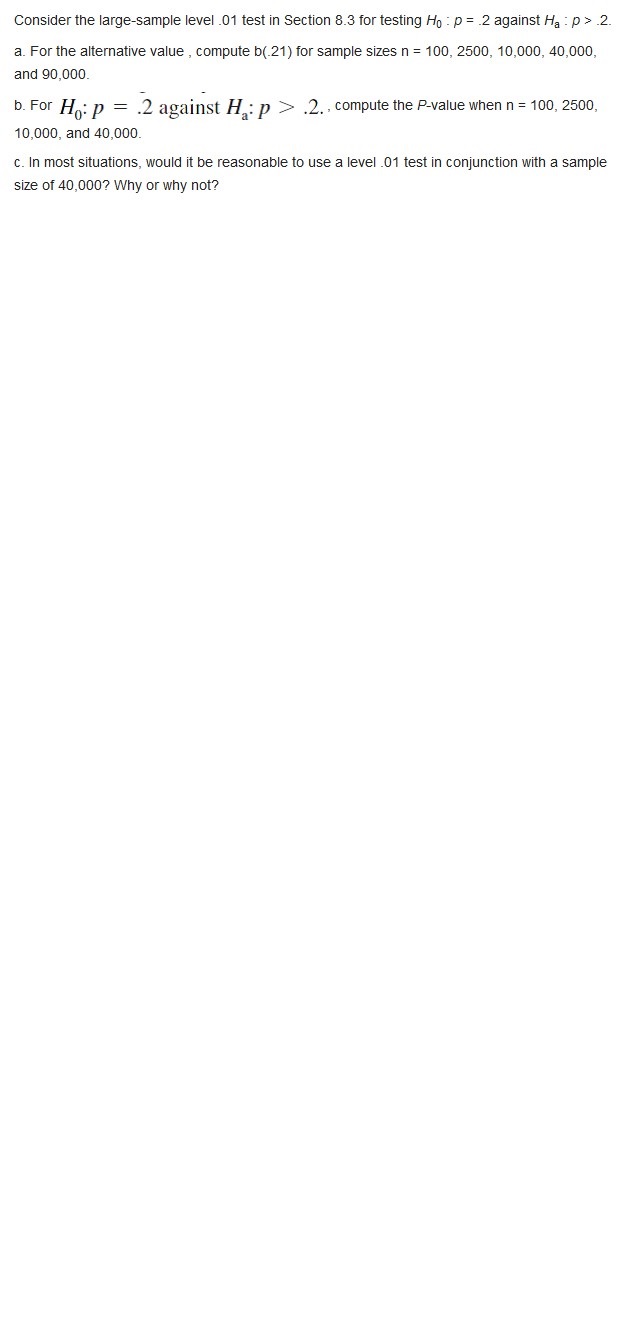
Wrinkle recovery angle and tensile strength are the two most important characteristics for evaluating the performance of crosslinked cotton fabric. An increase in the degree of crosslinking, as determined by ester carboxyl band absorbence, improves the wrinkle resistance of the fabric (at the expense of reducing mechanical strength). The accompanying data on x = absorbance and y = wrinke resistance angle was read from a graph in the paper "Predicting the Performance of Durable Press Finished Cotton Fabric with Infrared Spectroscopy" (Textile Res. J., 1999: 145-151). x .115 .126 .183 .246 .282 .344 .355 .452 .491 .554 .651 y 334 342 355 363 365 372 381 392 400 412 420 Here is regression output from Minitab: Predictor Coef SE Coef T P Constant 321 . 878 2.483 129 .64 0. 000 absorb 156. 711 6. 464 24.24 0. 000 S = 3. 60498 R-Sq = 98.5% R-Sq (adj ) = 98.3% Source DF SS MS F P Regression 1 7639.0 7639.0 587.81 0.000 Residual Error 9 117.0 13.0 Total 0 7756.0 a. Does the simple linear regression model appear to be appropriate? Explain. b. What wrinkle resistance angle would you predict for a fabric specimen having an absorbance of .300? c. What would be the estimate of expected wrinkle resistence angle when absorbance is 300?Biyanate data often arises from the use oftwo different techniques to measure the same quantity. As an example, the accompanying observations on X = hydrogen concentration {ppm} using a gas chromatography method and y = concentration using a new sensor method were read from a graph in the article "A New Method to Measure the Diffusible Hydrogen Content in Steel Weldments Using a Polymer ElectrolyteBased Hydrogen Sensor\" (Welding Res, July 199?: 251 s25tis]. x 4? 62 65 70 70 78 95 100114113 y 33 62 53 6? 84 79 93 106117116 1 124 12? 140 140 140 150 152 164 193 22] y 127 114 134 139 142 120 149 154 200 215 Construct a scatter plot. Does there appear to he a 1urery strong relationship between the two types of concentration measurements? Do the two methods appear to he measuring roughly the same quantity\"? Explain your reasoning. The accompanying data on y = ammonium concentration {mgfL} and x = Transpiration {MDl h) was read from a graph in the article "Response of Ammonium Removal To Growth and Transpiration of Juncuseffusus During The Treatment of Artificial Sewage in Laboratory .Scale Wetlands" [Water Research! 2013: 426542?3]. The article's abstract stated IIa linear correlation between the ammonium concentration inside the rhizosphere and The transpiration of The plant stocks implies That an influence of plant physiological activity on the efficiency of Hremoval exists.\" {The rhizosphere is the narrow region of soil at the plant rootsoil interface, and Transpiration is The process of Illvater movement Through a plant and its evaporation.) The article reported summary quantities from a simple linear regression analysis. Based on a scatterplot, how would you describe The relationship between The variables, and does simple linear regression appear To be an appropriate modeling strategy? 3.3 11.0 13.6 13.5 21.0 23.? y 7.3 3.2 6.9 5.3 4.? 4.9 4.3 J: '26.!) 28.3 31-9 36.5 33.2 40.4 )1 2.7 2.3 1.8 1.9 1.1 .4 A manufacturer of plumbing xtures has developed a new type of washeriess faucet. Let p = P(a randomly selected faucet of this type will develop a leak within 2 years under normal use). The manufacturer has decided to proceed with production unless it can be determined that p is too large; the borderline acceptable value of p is specified as .10. The manufacturer decides to subject n of these faucets to accelerated testing (approximating 2 years of normal use). With X = the number among the n faucets that leak before the test concludes, production will commence unless the observed X is too large. It is decided that if p = .10 , the probability of not proceeding should be at most .10, whereas if p = .30 the probability of proceeding should be at most .10. Can n = 10 be used? n = 20?n = 25 ? What is the appropriate rejection region for the chosen it, and what are the actual error probabilities when this region is used? Consider the largesample level .01 test in Section 8.3 for testing Hp : p = .2 against Ha : p > .2. a. For the arternathre value , compute M21) for sample sizes n = 100, 2500, 10,000, 40,000, and 90,000. b. For H0: P = :2 against H33)\" 3: _2_ , compute the Pvalue when n = 100, 2500, 10,000, and 40,000. c. In most situations, would it be reasonable to use a level .01 test in conjunction with a sample size of 40,000? Why or why not? In an investigation of the toxin produced by a certain poisonous snake, a researcher prepared 26 different vials, each containing 1g of the toxin, and then determined the amount of antitoxin needed to neutralize the toxin. The sample average amount of antitoxin necessary was found to be 1.89 mg, and the sample standard deviation was .42. Previous research had indicated that the true average neutralizing amount was 1.75 mg/g of toxin. Does the new data contradict the value suggested by prior research? Test the relevant hypotheses using the P-value approach. Does the validity of your analysis depend on any assumptions about the population distribution of neutralizing amount? Explain
