

Answered step by step
Verified Expert Solution
Question
1 Approved Answer
ANSWER TO THE PROBLEM IS PROVIDED IN PURPLE. Please show how to get these solutions in excel. Here, price premiums and discounts are indicated by
ANSWER TO THE PROBLEM IS PROVIDED IN PURPLE. Please show how to get these solutions in excel.
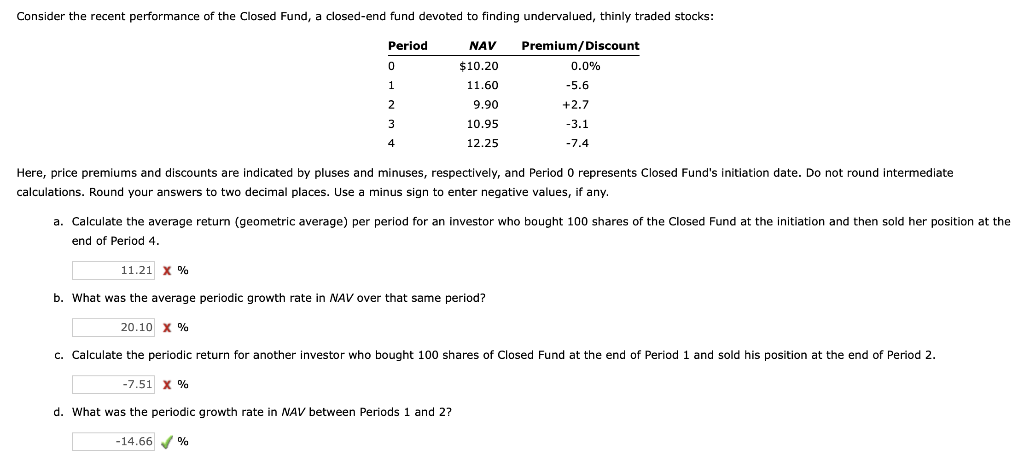
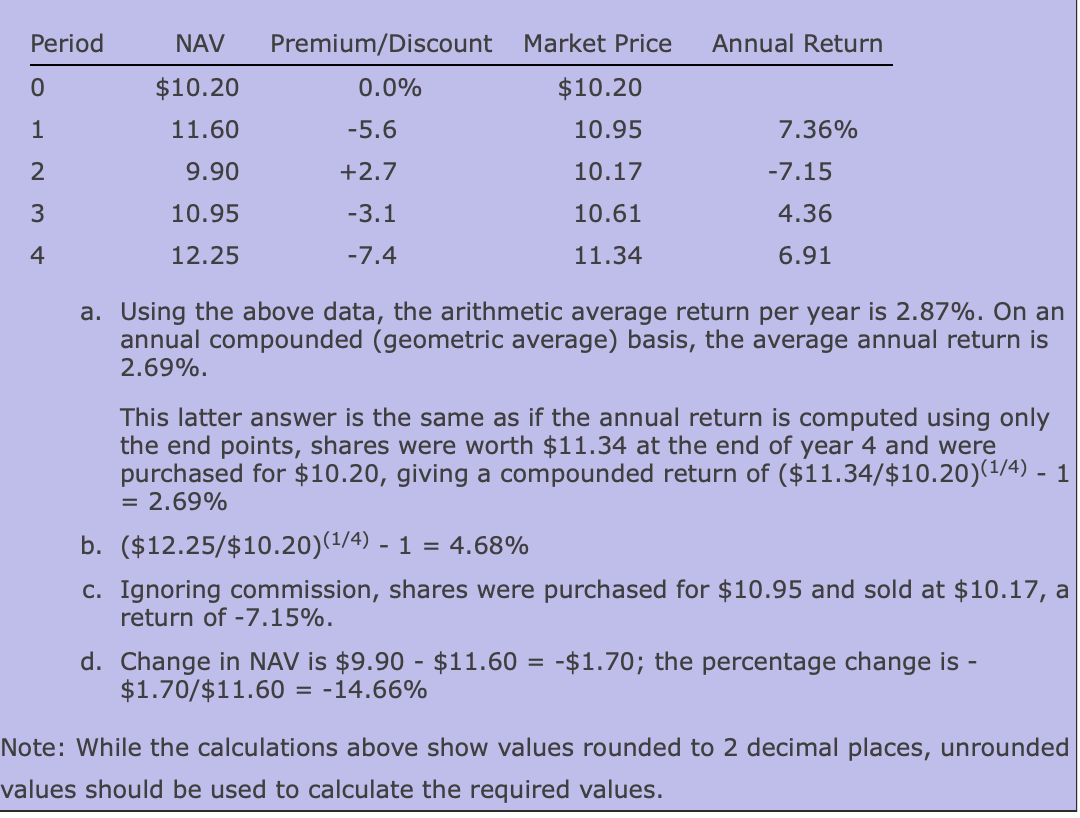
Here, price premiums and discounts are indicated by pluses and minuses, respectively, and Period 0 represents Closed Fund's initiation date. Do not round intermediate calculations. Round your answers to two decimal places. Use a minus sign to enter negative values, if any. a. Calculate the average return (geometric average) per period for an investor who bought 100 shares of the Closed Fund at the initiation and then sold her position at the end of Period 4. % b. What was the average periodic growth rate in NAV over that same period? % c. Calculate the periodic return for another investor who bought 100 shares of Closed Fund at the end of Period 1 and sold his position at the end of Period 2. % d. What was the periodic growth rate in NAV between Periods 1 and 2 ? a. Using the above data, the arithmetic average return per year is 2.87%. On an annual compounded (geometric average) basis, the average annual return is 2.69%. This latter answer is the same as if the annual return is computed using only the end points, shares were worth $11.34 at the end of year 4 and were purchased for $10.20, giving a compounded return of ($11.34/$10.20)(1/4)1 =2.69% b. ($12.25/$10.20)(1/4)1=4.68% C. Ignoring commission, shares were purchased for $10.95 and sold at $10.17, a return of 7.15%. d. Change in NAV is $9.90$11.60=$1.70; the percentage change is $1.70/$11.60=14.66% te: While the calculations above show values rounded to 2 decimal places, unrounded lues should be used to calculate the required valuesStep by Step Solution
There are 3 Steps involved in it
Step: 1

Get Instant Access to Expert-Tailored Solutions
See step-by-step solutions with expert insights and AI powered tools for academic success
Step: 2

Step: 3
Ace Your Homework with AI
Get the answers you need in no time with our AI-driven, step-by-step assistance
Get Started
Illustrating Finance Policy With Mathematica
Authors: Nicholas L. Georgakopoulos
1st Edition
3319953710, 978-3319953717