answer two with out anlyisis:
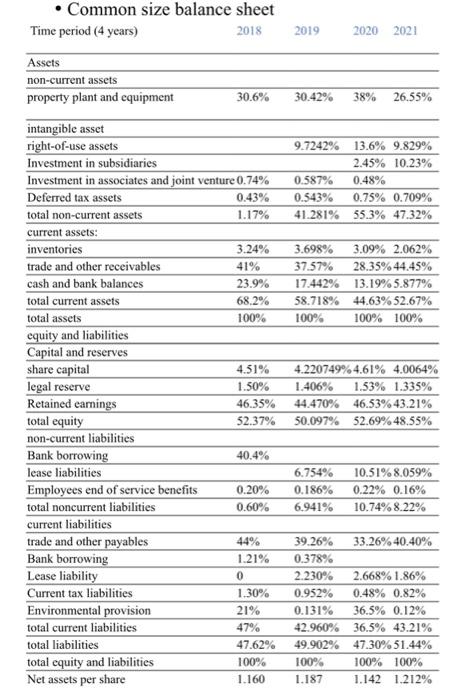
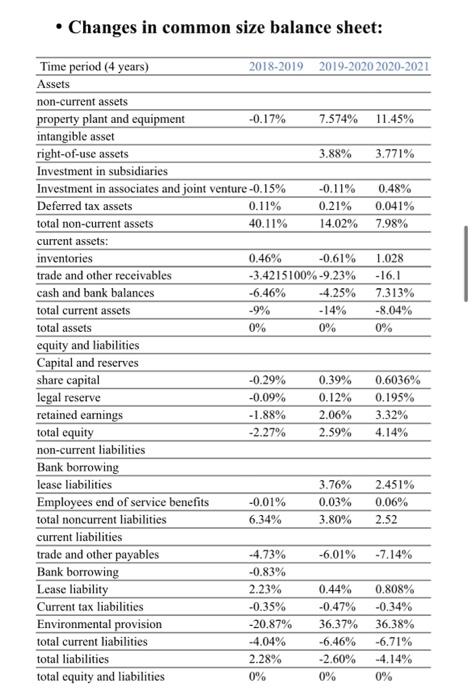
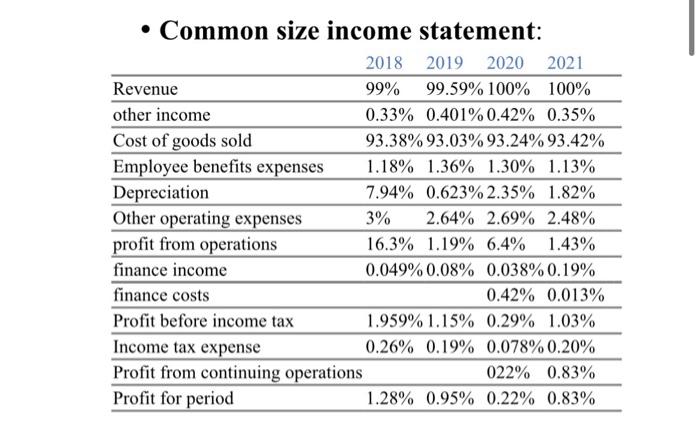
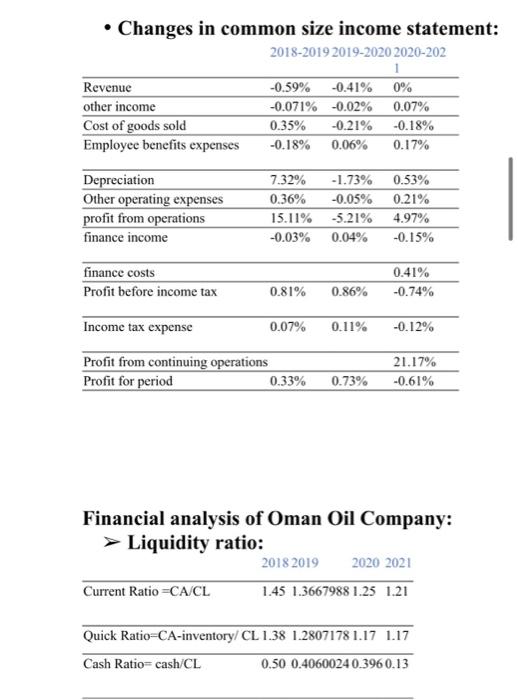
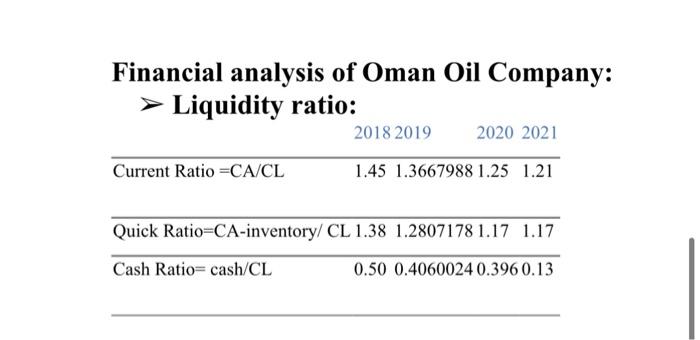
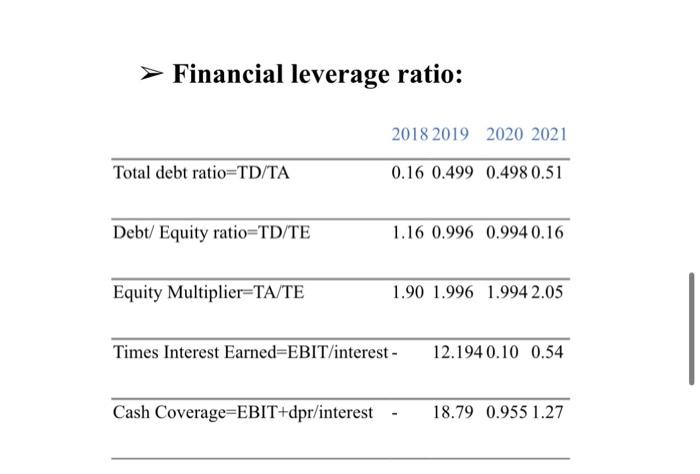
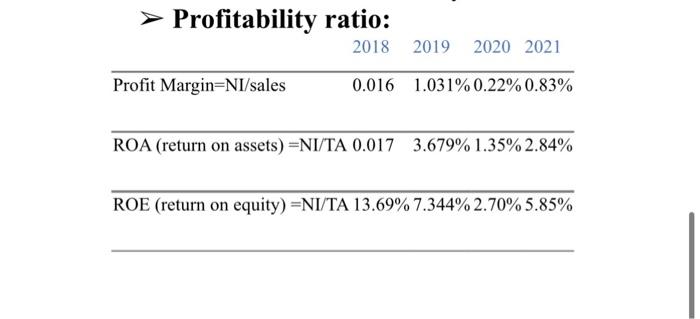
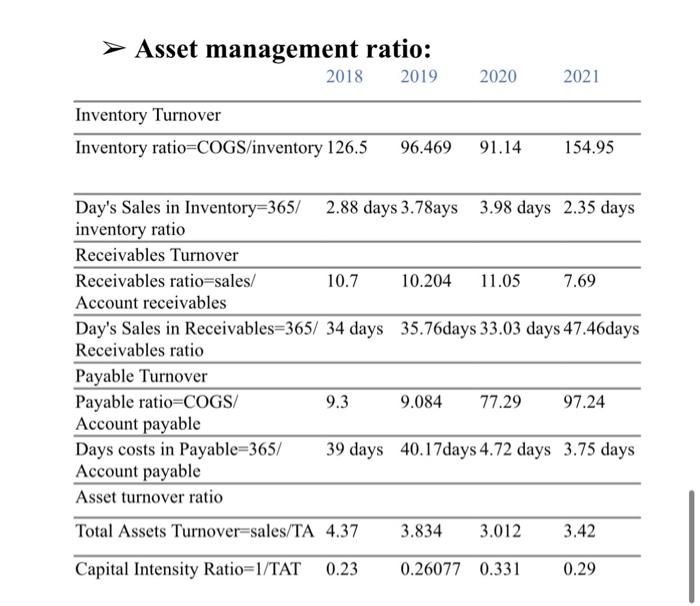
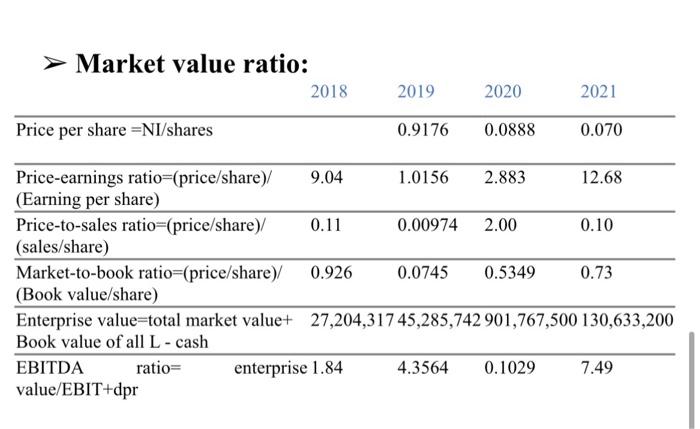
- Common size balance sheet \begin{tabular}{|c|c|c|c|c|} \hline Time period ( 4 years) & 2018 & 2019 & 2020 & 2021 \\ \hline \multicolumn{5}{|l|}{ Assets } \\ \hline \multicolumn{5}{|l|}{ non-current assets } \\ \hline property plant and equipment & 30.6% & 30.42% & 38% & 26.55% \\ \hline \multicolumn{5}{|l|}{ intangible asset } \\ \hline right-of-use assets & & 9.7242% & 13.6% & 9.829% \\ \hline Investment in subsidiaries & & & 2.45% & 10.23% \\ \hline Investment in associates and joint v & 0.74% & 0.587% & 0.48% & \\ \hline Deferred tax assets & 0.43% & 0.543% & 0.75% & 0.709% \\ \hline total non-current assets & 1.17% & 41.281% & 55.3% & 47.32% \\ \hline \multicolumn{5}{|l|}{ current assets: } \\ \hline inventories & 3.24% & 3.698% & 3.09% & 2.062% \\ \hline trade and other receivables & 41% & 37.57% & 28.35% & 44.45% \\ \hline cash and bank balances & 23.9% & 17.442% & 13.19% & 65.877% \\ \hline total current assets & 68.2% & 58.718% & 44.63% & 652.67% \\ \hline total assets & 100% & 100% & 100% & 100% \\ \hline \multicolumn{5}{|l|}{ equity and liabilities } \\ \hline \multicolumn{5}{|l|}{ Capital and reserves } \\ \hline share capital & 4.51% & \multicolumn{3}{|c|}{4.220749%4.61%} \\ \hline legal reserve & 1.50% & 1.406% & 1.53% & 1.335% \\ \hline Retained eamings & 46.35% & 44.470% & 46.53% & 643.21% \\ \hline total equity & 52.37% & 50.097% & 52.69% & .48.55% \\ \hline \multicolumn{5}{|l|}{ non-current liabilities } \\ \hline Bank borrowing & 40.4% & & & \\ \hline lease liabilities & & 6.754% & 10.51% & 8.059% \\ \hline Employees end of service benefits & 0.20% & 0.186% & 0.22% & 0.16% \\ \hline total noncurrent liabilities & 0.60% & 6.941% & 10.74% & 68.22% \\ \hline \multicolumn{5}{|l|}{ current liabilities } \\ \hline trade and other payables & 44% & 39.26% & 33.26% & 640.40% \\ \hline Bank borrowing & 1.21% & 0.378% & & \\ \hline Lease liability & 0 & 2.230% & 2.668% & 61.86% \\ \hline Current tax liabilities & 1.30% & 0.952% & 0.48% & 0.82% \\ \hline Environmental provision & 21% & 0.131% & 36.5% & 0.12% \\ \hline total current liabilities & 47% & 42.960% & 36.5% & 43.21% \\ \hline total liabilities & 47.62% & 49.902% & 47.30% & 651.44% \\ \hline total equity and liabilities & 100% & 100% & 100% & 100% \\ \hline Net assets per share & 1.160 & 1.187 & 1.142 & 1.212% \\ \hline \end{tabular} - Chanore in sommon cizo holanso choot. - Common size income statement: - Changes in common size income statement: Financial analysis of Oman Oil Company: > Liquidity ratio: Financial analysis of Oman Oil Company: > Liauidity ratio: > Financial leverage ratio: \begin{tabular}{|c|c|c|} \hline \multicolumn{3}{|c|}{\begin{tabular}{l} Profitability ratio: \\ 2018201920202021 \end{tabular}} \\ \hline Profit Margin=NI/sales & 0.016 & 1.031%0.22%0.83% \\ \hline ROA( return on assets )= & A 0.017 & 3.679%1.35%2.84% \\ \hline ROE (return on equity) & A 13.69 & 67.344%2.70%5.85% \\ \hline \end{tabular} > Asset management ratio: 2018201920202021 \begin{tabular}{llll} \hline Inventory Turnover & & & \\ \hline Inventory ratio=COGS/inventory 126.5 & 96.469 & 91.14 & 154.95 \end{tabular} \begin{tabular}{lllll} \hline \begin{tabular}{l} Day's Sales in Inventory=365/ \\ inventory ratio \end{tabular} & 2.88 days 3.78ays & 3.98 days & 2.35 days \\ \hline Receivables Turnover & & & & \\ \hline \begin{tabular}{l} Receivables ratio=sales/ \\ Account receivables \end{tabular} & 10.7 & 10.204 & 11.05 & 7.69 \\ \begin{tabular}{l} Day's Sales in Receivables=365/ \\ Receivables ratio \end{tabular} & & & & \\ \hline Payable Turnover & 35.76 days 33.03 days 47.46 days \\ \begin{tabular}{l} Payable ratio=COGS/ \\ Account payable \end{tabular} & 9.3 & 9.084 & 77.29 & 97.24 \\ \hline \begin{tabular}{l} Days costs in Payable=365/ \\ Account payable \end{tabular} & 39 days & 40.17 days 4.72 days & 3.75 days \\ \hline \begin{tabular}{l} Asset turnover ratio \\ Total Assets Turnover=sales/TA \end{tabular} & 4.37 & 3.834 & 3.012 & 3.42 \\ \hline Capital Intensity Ratio=1/TAT & 0.23 & 0.26077 & 0.331 & 0.29 \end{tabular} > Market value ratio: Task 2 For the selected company in Task 1, prepare a report on current Capital Structure. Using information available in public domain, calculate the weighted average cost of capital and the cost of equity. Consider that the firm is expected to maintain the profit (average of four years) forever, calculate the value of unlevered firm. If the firm intends to restructure its capital by raising debt, equal to 10% of the total equity, calculate the value of levered firm. The report should recommendation, based on your analysis, addressed to company management. Task 3 For the selected company in Task 1, using DuPont Analysis, prepare a report on the major determinant of profitability. The report should include the calculations (DuPont Analysis) for four years and show the factors that contribute to the ROE of the company. - Common size balance sheet \begin{tabular}{|c|c|c|c|c|} \hline Time period ( 4 years) & 2018 & 2019 & 2020 & 2021 \\ \hline \multicolumn{5}{|l|}{ Assets } \\ \hline \multicolumn{5}{|l|}{ non-current assets } \\ \hline property plant and equipment & 30.6% & 30.42% & 38% & 26.55% \\ \hline \multicolumn{5}{|l|}{ intangible asset } \\ \hline right-of-use assets & & 9.7242% & 13.6% & 9.829% \\ \hline Investment in subsidiaries & & & 2.45% & 10.23% \\ \hline Investment in associates and joint v & 0.74% & 0.587% & 0.48% & \\ \hline Deferred tax assets & 0.43% & 0.543% & 0.75% & 0.709% \\ \hline total non-current assets & 1.17% & 41.281% & 55.3% & 47.32% \\ \hline \multicolumn{5}{|l|}{ current assets: } \\ \hline inventories & 3.24% & 3.698% & 3.09% & 2.062% \\ \hline trade and other receivables & 41% & 37.57% & 28.35% & 44.45% \\ \hline cash and bank balances & 23.9% & 17.442% & 13.19% & 65.877% \\ \hline total current assets & 68.2% & 58.718% & 44.63% & 652.67% \\ \hline total assets & 100% & 100% & 100% & 100% \\ \hline \multicolumn{5}{|l|}{ equity and liabilities } \\ \hline \multicolumn{5}{|l|}{ Capital and reserves } \\ \hline share capital & 4.51% & \multicolumn{3}{|c|}{4.220749%4.61%} \\ \hline legal reserve & 1.50% & 1.406% & 1.53% & 1.335% \\ \hline Retained eamings & 46.35% & 44.470% & 46.53% & 643.21% \\ \hline total equity & 52.37% & 50.097% & 52.69% & .48.55% \\ \hline \multicolumn{5}{|l|}{ non-current liabilities } \\ \hline Bank borrowing & 40.4% & & & \\ \hline lease liabilities & & 6.754% & 10.51% & 8.059% \\ \hline Employees end of service benefits & 0.20% & 0.186% & 0.22% & 0.16% \\ \hline total noncurrent liabilities & 0.60% & 6.941% & 10.74% & 68.22% \\ \hline \multicolumn{5}{|l|}{ current liabilities } \\ \hline trade and other payables & 44% & 39.26% & 33.26% & 640.40% \\ \hline Bank borrowing & 1.21% & 0.378% & & \\ \hline Lease liability & 0 & 2.230% & 2.668% & 61.86% \\ \hline Current tax liabilities & 1.30% & 0.952% & 0.48% & 0.82% \\ \hline Environmental provision & 21% & 0.131% & 36.5% & 0.12% \\ \hline total current liabilities & 47% & 42.960% & 36.5% & 43.21% \\ \hline total liabilities & 47.62% & 49.902% & 47.30% & 651.44% \\ \hline total equity and liabilities & 100% & 100% & 100% & 100% \\ \hline Net assets per share & 1.160 & 1.187 & 1.142 & 1.212% \\ \hline \end{tabular} - Chanore in sommon cizo holanso choot. - Common size income statement: - Changes in common size income statement: Financial analysis of Oman Oil Company: > Liquidity ratio: Financial analysis of Oman Oil Company: > Liauidity ratio: > Financial leverage ratio: \begin{tabular}{|c|c|c|} \hline \multicolumn{3}{|c|}{\begin{tabular}{l} Profitability ratio: \\ 2018201920202021 \end{tabular}} \\ \hline Profit Margin=NI/sales & 0.016 & 1.031%0.22%0.83% \\ \hline ROA( return on assets )= & A 0.017 & 3.679%1.35%2.84% \\ \hline ROE (return on equity) & A 13.69 & 67.344%2.70%5.85% \\ \hline \end{tabular} > Asset management ratio: 2018201920202021 \begin{tabular}{llll} \hline Inventory Turnover & & & \\ \hline Inventory ratio=COGS/inventory 126.5 & 96.469 & 91.14 & 154.95 \end{tabular} \begin{tabular}{lllll} \hline \begin{tabular}{l} Day's Sales in Inventory=365/ \\ inventory ratio \end{tabular} & 2.88 days 3.78ays & 3.98 days & 2.35 days \\ \hline Receivables Turnover & & & & \\ \hline \begin{tabular}{l} Receivables ratio=sales/ \\ Account receivables \end{tabular} & 10.7 & 10.204 & 11.05 & 7.69 \\ \begin{tabular}{l} Day's Sales in Receivables=365/ \\ Receivables ratio \end{tabular} & & & & \\ \hline Payable Turnover & 35.76 days 33.03 days 47.46 days \\ \begin{tabular}{l} Payable ratio=COGS/ \\ Account payable \end{tabular} & 9.3 & 9.084 & 77.29 & 97.24 \\ \hline \begin{tabular}{l} Days costs in Payable=365/ \\ Account payable \end{tabular} & 39 days & 40.17 days 4.72 days & 3.75 days \\ \hline \begin{tabular}{l} Asset turnover ratio \\ Total Assets Turnover=sales/TA \end{tabular} & 4.37 & 3.834 & 3.012 & 3.42 \\ \hline Capital Intensity Ratio=1/TAT & 0.23 & 0.26077 & 0.331 & 0.29 \end{tabular} > Market value ratio: Task 2 For the selected company in Task 1, prepare a report on current Capital Structure. Using information available in public domain, calculate the weighted average cost of capital and the cost of equity. Consider that the firm is expected to maintain the profit (average of four years) forever, calculate the value of unlevered firm. If the firm intends to restructure its capital by raising debt, equal to 10% of the total equity, calculate the value of levered firm. The report should recommendation, based on your analysis, addressed to company management. Task 3 For the selected company in Task 1, using DuPont Analysis, prepare a report on the major determinant of profitability. The report should include the calculations (DuPont Analysis) for four years and show the factors that contribute to the ROE of the company