

Answered step by step
Verified Expert Solution
Question
1 Approved Answer
Anyone can help? Consider the figure below. Whar does the section AB represent? Safety stock Unused stock Backorders Shortages The probability of demand for an
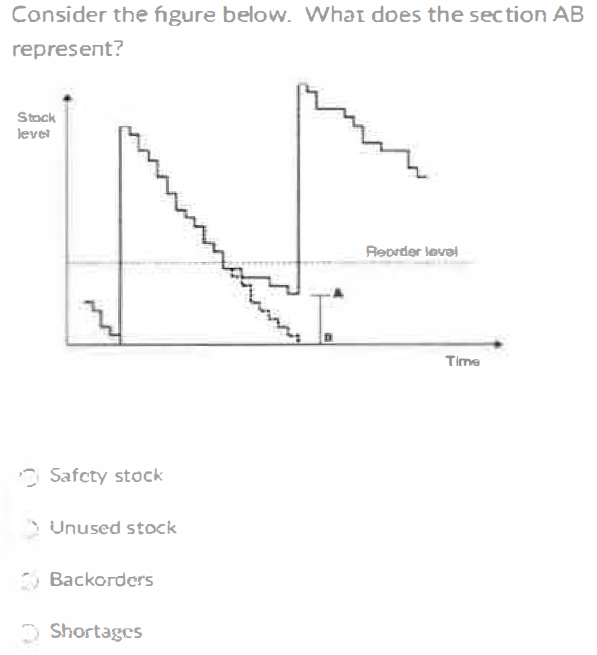
Anyone can help?
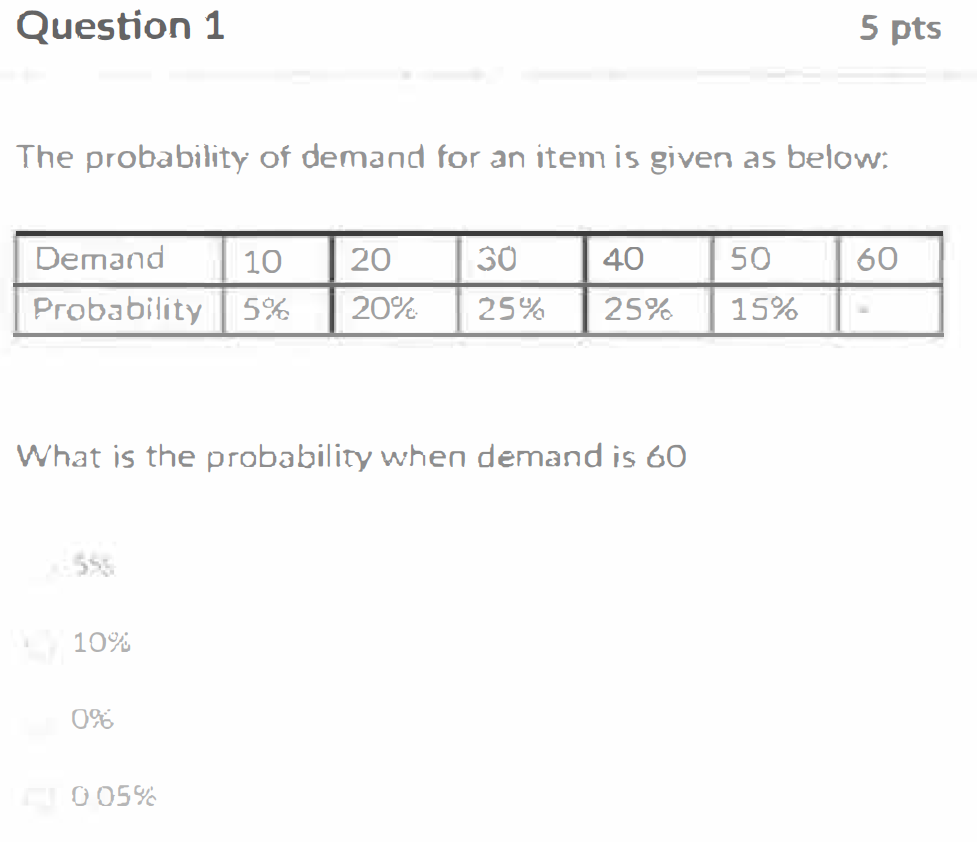
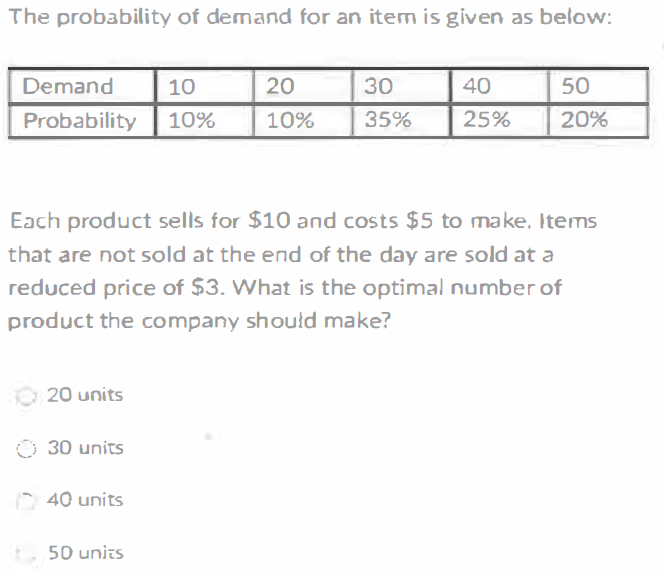
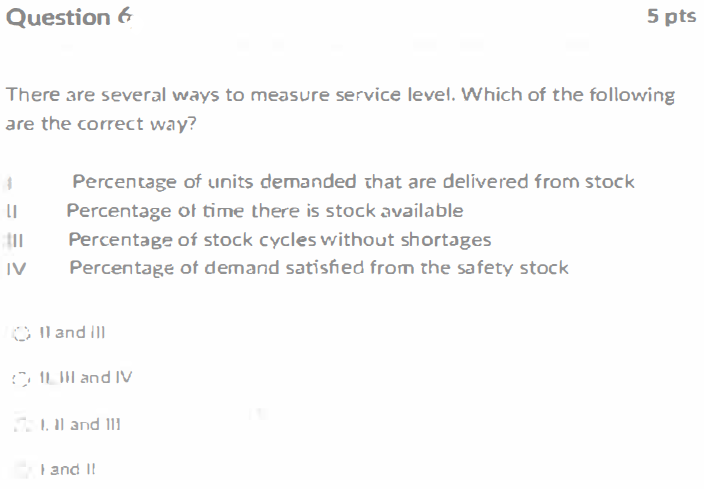
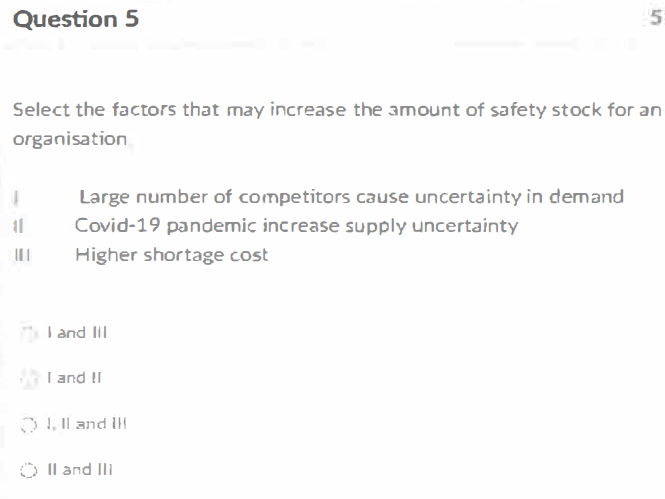
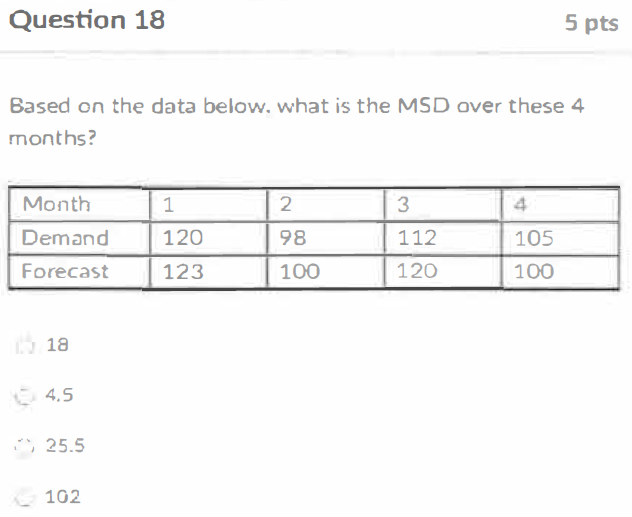
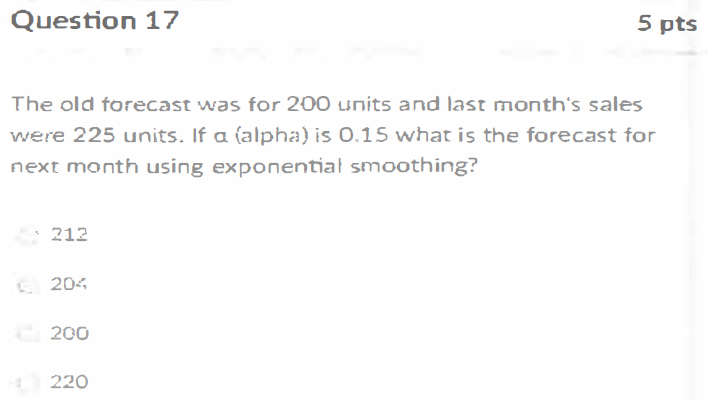
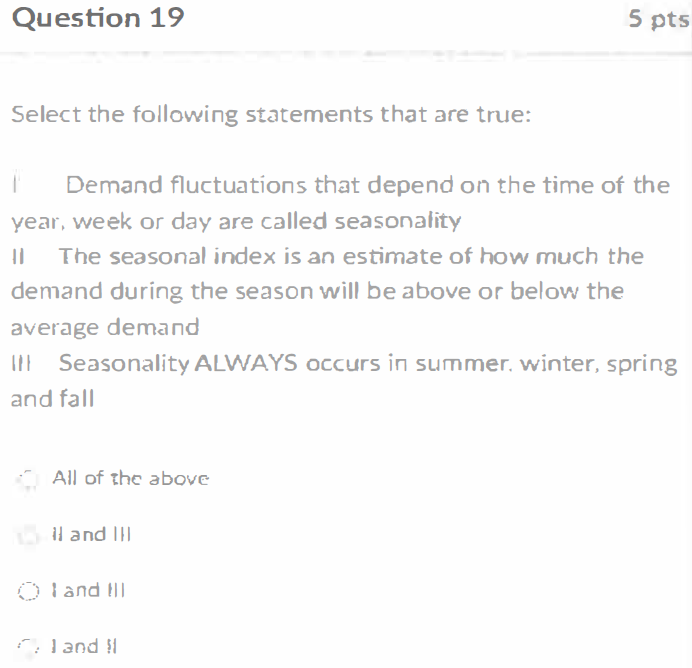
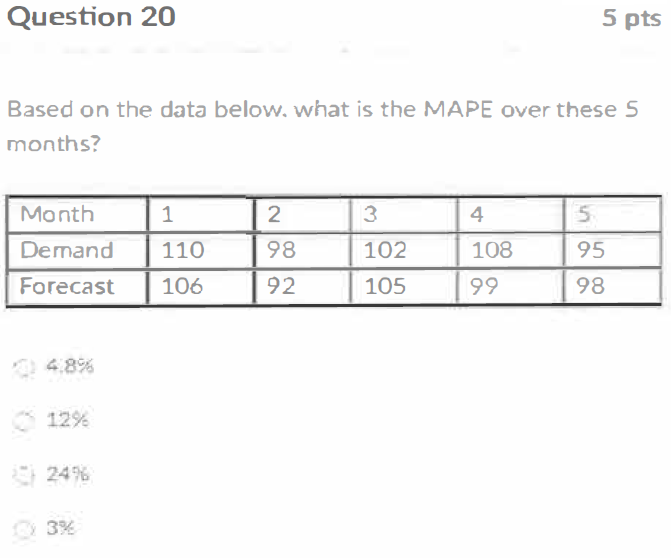
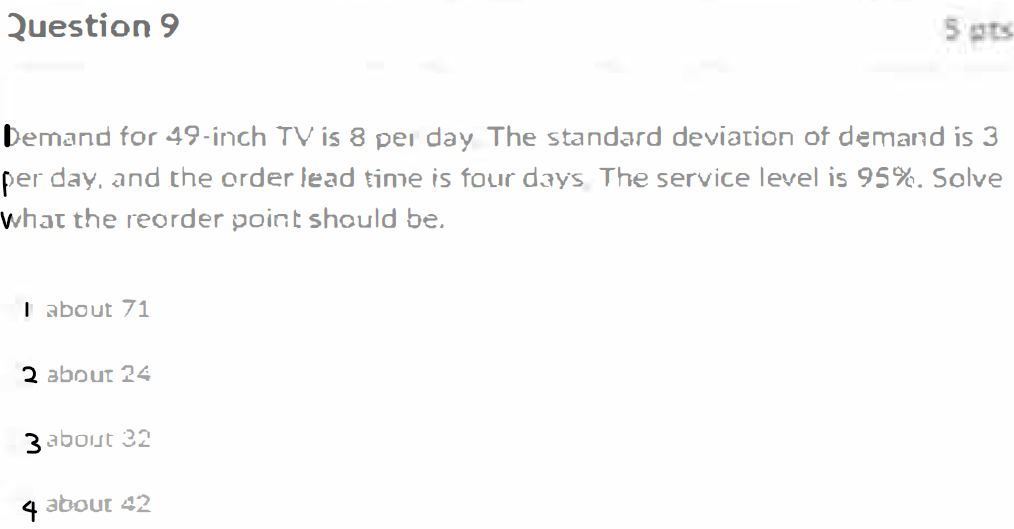
Consider the figure below. Whar does the section AB represent? Safety stock Unused stock Backorders Shortages The probability of demand for an item is given as below: What is the probability when demand is 60 55 10% 0% 005% The probability of demand for an item is given as below: Each product sells for $10 and costs $5 to make. Items that are not sold at the end of the day are sold at a reduced price of $3. What is the optimal number of product the company should make? 20 units 30 units 40 units 50 units There are several ways to measure service level. Which of the following are the correct way? Percentage of units demanded that are delivered from stock Percentage of time there is stock available Percentage of stock cycles without shortages Percentage of demand satisfied from the safety stock II and III II III and IV 1.11 and 111 and If Select the factors that may increase the amount of safety stock for an organisation Large number of competitors cause uncertainty in demand Covid-19 pandemic increase supply uncertainty Higher shortage cost I and III I and II 3) I, II and III II and III Based on the data below. what is the MSD over these 4 months? 18 4.5 25.5 102 The old forecast was for 200 units and last month's sales were 225 units. If a (alpha) is 0.15 what is the forecast for next month using exponential smoothing? 212 20z 200 220 Select the following statements that are true: I Demand fluctuations that depend on the time of the year, week or day are called seasonality II The seasonal index is an estimate of how much the demand during the season will be above or below the average demand III Seasonality ALWAYS occurs in summer. winter, spring and fall All of the above II and III i and III I and!| Based on the data below. what is the MAPE over these 5 months? 4.8% 12% 24% 3% Demand for 49 -inch TV is 8 pel day The standard deviation of demand is 3 per day, and the order lead tine is four days The service level is 95%. Solve what the reorder point should be. about 71 2 about 24 3 about 32 4 bbout 42Step by Step Solution
There are 3 Steps involved in it
Step: 1

Get Instant Access to Expert-Tailored Solutions
See step-by-step solutions with expert insights and AI powered tools for academic success
Step: 2

Step: 3
Ace Your Homework with AI
Get the answers you need in no time with our AI-driven, step-by-step assistance
Get Started
The Making Of Finance
Authors: Isabelle Chambost, Marc Lenglet, Yamina Tadjeddine
1st Edition
1138498572, 978-1138498570