Anyone who is expert in economics .?
Please solve these Problems of part 1 .
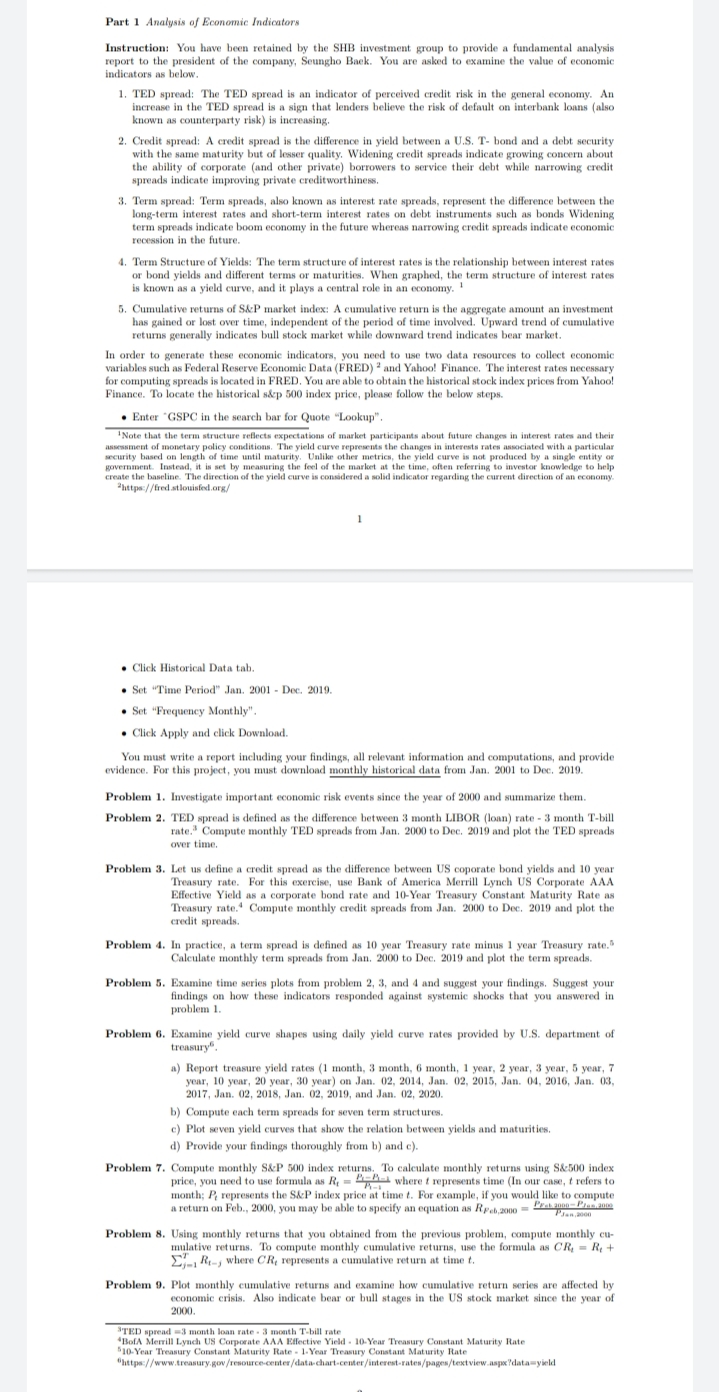
Part 1 Analysis of Economic Indicators Instruction: You have been retained by the SHB investment group to provide a fundamental analysis report to the president of the company, Seungho Back. You are asked to examine the value of economic indicators as below. 1. TED spread: The TED spread is an indicator of perceived credit risk in the general economy. An increase in the TED spread is a sign that lenders believe the risk of default on interbank loans (also known as counterparty risk) is increasing. 2. Credit spread: A credit spread is the difference in yield between a U.S. T- bond and a debt security with the same maturity but of lesser quality. Widening credit spreads indicate growing concern about the ability of corporate (and other private) borrowers to service their debt while narrowing credit spreads indicate improving private creditworthiness. 3. Term spread: Term spreads, also known as interest rate spreads, represent the difference between the long-term interest rates and short-term interest rates on debt instruments such as bonds Widening term spreads indicate boom economy in the future whereas narrowing credit spreads indicate economic recession in the future. 4. Term Structure of Yields: The term structure of interest rates is the relationship between interest rates or bond yields and different terms or maturities. When graphed, the term structure of interest rates is known as a yield curve, and it plays a central role in an economy. 5. Cumulative returns of S&P market index: A cumulative return is the aggregate amount an investment has gained or lost over time, independent of the period of time involved. Upward trend of cumulative returns generally indicates bull stock market while downward trend indicates bear market. In order to generate these economic indicators, you need to use two data resources to collect economic variables such as Federal Reserve Economic Data (FRED) . and Yahoo! Finance. The interest rates necessary for computing spreads is located in FRED. You are able to obtain the historical stock index prices from Yahoo! Finance. To locate the historical s&p 500 index price, please follow the below steps. . Enter "GSPC in the search bar for Quote "Lookup". 'Note that the term structure reflects expectations of market participants about future changes in interest rates and their assessment of monetary policy conditions, The yield curve represents the changes in interests rates associated with a particular security based on length of time until maturity. Unlike other metrics, the yield curve is not produced by a single entity or government. Instead, it is set by measuring the feel of the market at the time, often referring to investor knowledge to help create the baseline. The direction of the yield curve is considered a solid indicator regarding the current direction of an economy. https://fred.atlouisfed.org/ . Click Historical Data tab. . Set "Time Period" Jan. 2001 - Dec. 2019. . Set "Frequency Monthly". . Click Apply and click Download. You must write a report including your findings, all relevant information and computations, and provide evidence. For this project, you must download monthly historical data from Jan. 2001 to Dec. 2019. Problem 1. Investigate important economic risk events since the year of 2000 and summarize them. Problem 2. TED spread is defined as the difference between 3 month LIBOR (loan) rate - 3 month T-bill rate. Compute monthly TED spreads from Jan. 2000 to Dec. 2019 and plot the TED spreads over time. Problem 3. Let us define a credit spread as the difference between US coporate bond yields and 10 year Treasury rate. For this exercise, use Bank of America Merrill Lynch US Corporate AAA Effective Yield as a corporate bond rate and 10-Year Treasury Constant Maturity Rate as Treasury rate.' Compute monthly credit spreads from Jan. 2000 to Dec. 2019 and plot the credit spreads. Problem 4. In practice, a term spread is defined as 10 year Treasury rate minus 1 year Treasury rate." Calculate monthly term spreads from Jan. 2000 to Dec. 2019 and plot the term spreads. Problem 5. Examine time series plots from problem 2, 3, and 4 and suggest your findings. Suggest your findings on how these indicators responded against systemic shocks that you answered in problem 1. Problem 6. Examine yield curve shapes using daily yield curve rates provided by U.S. department of treasury". a) Report treasure yield rates (1 month, 3 month, 6 month, 1 year, 2 year, 3 year, 5 year, 7 year, 10 year, 20 year, 30 year) on Jan. 02, 2014, Jan. 02, 2015, Jan. 04, 2016, Jan. 03, 2017, Jan. 02, 2018, Jan. 02, 2019, and Jan. 02, 2020. b) Compute each term spreads for seven term structures. c) Plot seven yield curves that show the relation between yields and maturities. d) Provide your findings thoroughly from b) and c). Problem 7. Compute monthly S&P 500 index returns. To calculate monthly returns using S&500 index price, you need to use formula as Ry = = where f represents time (In our case, t refers to month; P. represents the S&P index price at time t. For example, if you would like to compute a return on Feb., 2000, you may be able to specify an equation as Reb,2000 - Pest ance- Prep,ance Problem 8. Using monthly returns that you obtained from the previous problem, compute monthly cu- mulative returns. To compute monthly cumulative returns, use the formula as CR, = R + El Rey where CR, represents a cumulative return at time t. Problem 9. Plot monthly cumulative returns and examine how cumulative return series are affected by economic crisis. Also indicate bear or bull stages in the US stock market since the year of 2000. STED spread =3 month loan rate . 3 month T-bill rate "BofA Merrill Lynch US Corporate AAA Effective Yield - 10-Year Treasury Constant Maturity Rate 510-Year Treasury Constant Maturity Rate - 1-Year Treasury Constant Maturity Rate "http://www.treasury.gov/resource-center/data-chart-center/interest-rates/pages/textview.aspx?data=yield


