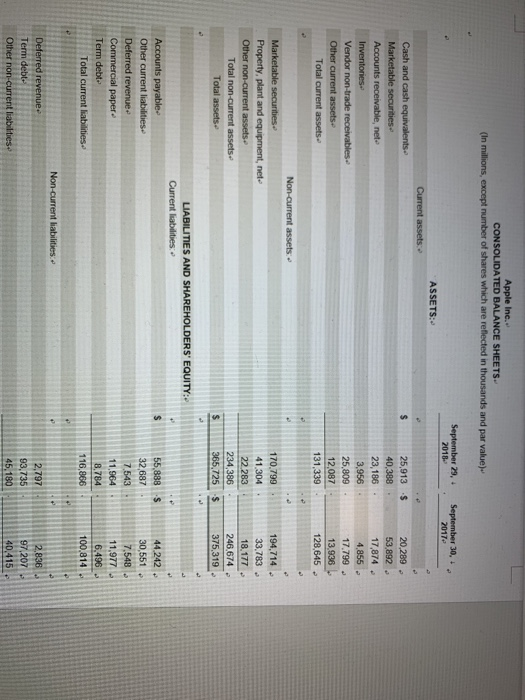
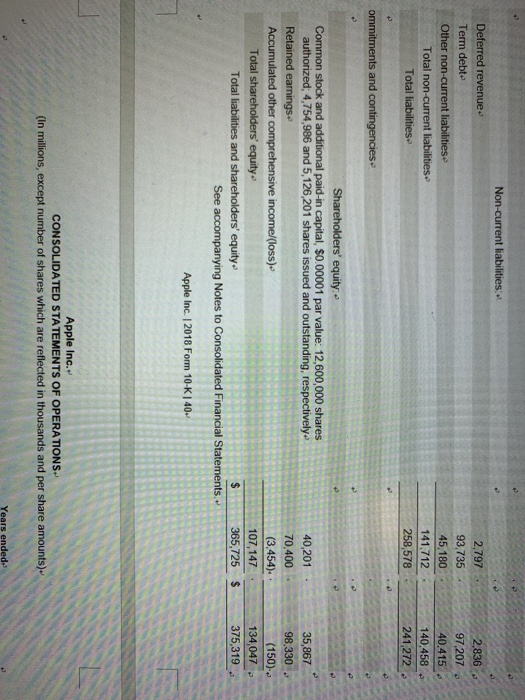
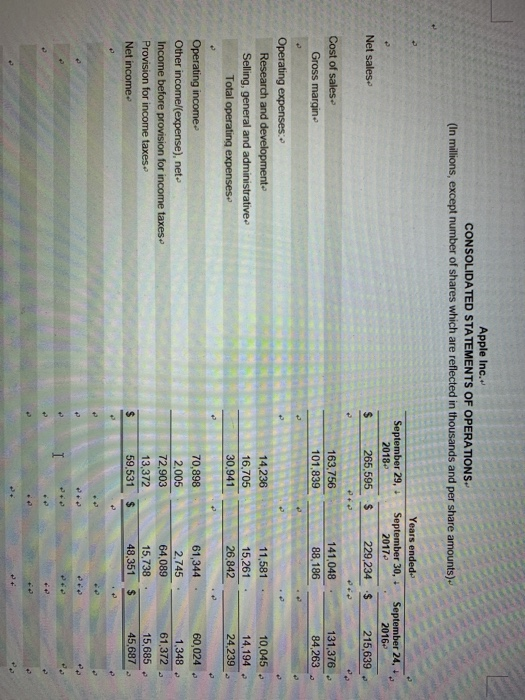
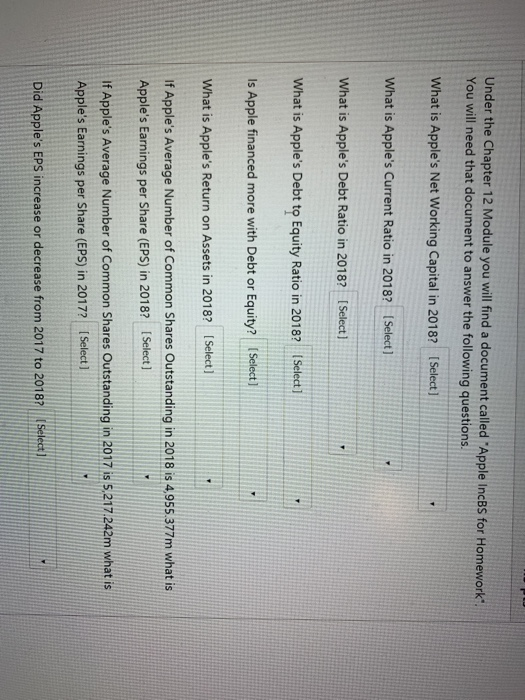
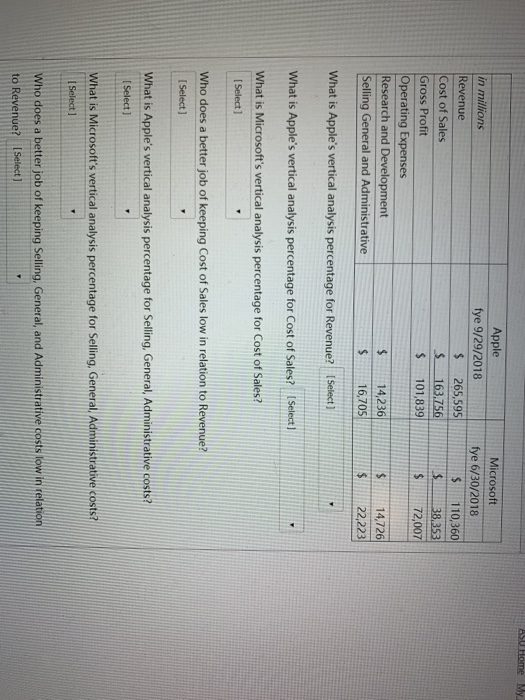
Apple Inc. CONSOLIDATED BALANCE SHEETS (In millions, except number of shares which are reflected in thousands and par value) September 29, 2018. September 30, + 2017 ASSETS:- Current assets $ Cash and cash equivalents Marketable securities Accounts receivable, net Inventories Vendor non-trade receivables. Other current assets- Total current assets 25,913 40,388 23,186 3,956 25,809 12,087 131,339 20.289 53 892 - 17,874 4,855 - 17.799 13,936 128,645 Non-current assets Marketable securities Property, plant and equipment, net Other non-current assets. Total non-current assets. Total assets 170.799 41,304 22 283 234,386 365,725 194,714 33,783 18.177 - 246,674 375,319 S LIABILITIES AND SHAREHOLDERS' EQUITY: Current liabilities $ Accounts payable- Other current liabilities Deferred revenue Commercial paper Term debt: Total current liabilities 55,888 32,687 7.543 11,964 8.784 116,866 44 242 30,551 7,548 - 11,977 6,496 100.814. Non-current liabilities Deferred revenue Term debt- Other non-current liabilities 2,797 93,735 45.180 2,836 97,207 40.415 - Non-current liabilities: Deferred revenue- Term debto Other non-current liabilities Total non-current liabilities Total liabilities 2,797 93,735 45.180 141,712 258,578 2,836 97207 40,415 140,458 241 272 ommitments and contingencies 35,867 98,330 Shareholders' equity Common stock and additional paid-in capital, $0.00001 par value: 12,600,000 shares authorized 4,754,986 and 5,126,201 shares issued and outstanding, respectively Retained earnings- Accumulated other comprehensive income (loss) Total shareholders' equity Total liabilities and shareholders' equity $ See accompanying Notes to Consolidated Financial Statements. 40,201 - 70,400 (3,454). 107,147 365,725 $ (150)- 134,047 375,319 Apple Inc. 2018 Form 10-K40- Apple Inc. CONSOLIDATED STATEMENTS OF OPERATIONS (In millions, except number of shares which are reflected in thousands and per share amounts) Years ended- Apple Inc. CONSOLIDATED STATEMENTS OF OPERATIONS (In millions, except number of shares which are reflected in thousands and per share amounts) September 29, 2018 $ 265,595 Years endede September 30, 2017 $ 229,234 September 24, 2016 $ 215.639 Net sales Cost of sales Gross margin- 163,756 101,839 141,048 8,186 131,376 84,263 8 Operating expenses: Research and development Selling, general and administrative Total operating expenses 14,236 16,705 30.941 1 1,581 1 5.261 26,842 10,045. 14,194 24,239 Operating income Other incomel (expense), net- Income before provision for income taxes Provision for income taxes Net income 70,898 2.005 72,903 13,372 59,531 61,344. 2,745 . 64,089 15.738 . 48,351 $ 60,024 1,348 61,372 15,685 - 45,687 $ $ Under the Chapter 12 Module you will find a document called "Apple IncBs for Homework. You will need that document to answer the following questions. What is Apple's Net Working Capital in 2018? [Select] What is Apple's Current Ratio in 2018? (Select] What is Apple's Debt Ratio in 2018? [Select] What is Apple's Debt to Equity Ratio in 2018? (Select] Is Apple financed more with Debt or Equity? Select) What is Apple's Return on Assets in 2018? (Select] If Apple's Average Number of Common Shares Outstanding in 2018 is 4,955 Apple's Earnings per Share (EPS) in 2018? [Select] If Apple's Average Number of Common Shares Outstanding in 2017 is 5.217.242m what is Apple's Earnings per Share (EPS) in 2017? (Select] Did Apple's EPS increase or decrease from 2017 to 2018? (Select) ASU Home My in millions Revenue Cost of Sales Gross Profit Operating Expenses Research and Development Selling General and Administrative Apple fye 9/29/2018 $ 265,595 $ 163.756 $ 101,839 Microsoft fye 6/30/2018 $ 110,360 $ 38353 $ 72,007 14,236 16,705 14,726 22,223 What is Apple's vertical analysis percentage for Revenue? Select) What is Apple's vertical analysis percentage for Cost of Sales? (Select] What is Microsoft's vertical analysis percentage for Cost of Sales? [Select) Who does a better job of keeping Cost of Sales low in relation to Revenue? [Select) What is Apple's vertical analysis percentage for Selling, General Administrative costs? [Select) What is Microsoft's vertical analysis percentage for Selling, General Administrative costs? Select ] Who does a better job of keeping Selling, General, and Administrative costs low in relation to Revenue? (Select)