Apple Ratio Analysis
Background Information:
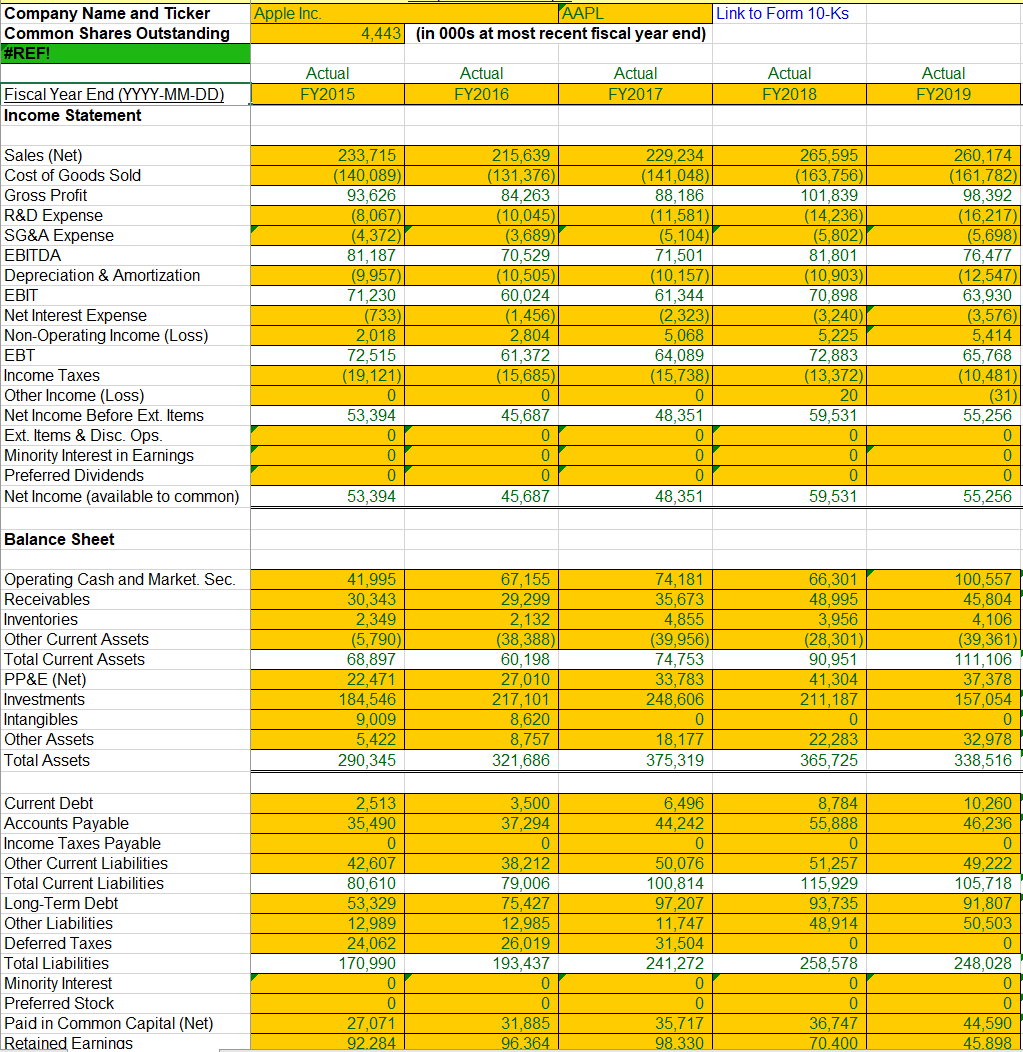

Question: I have the data sheets and need help filling out the table below.
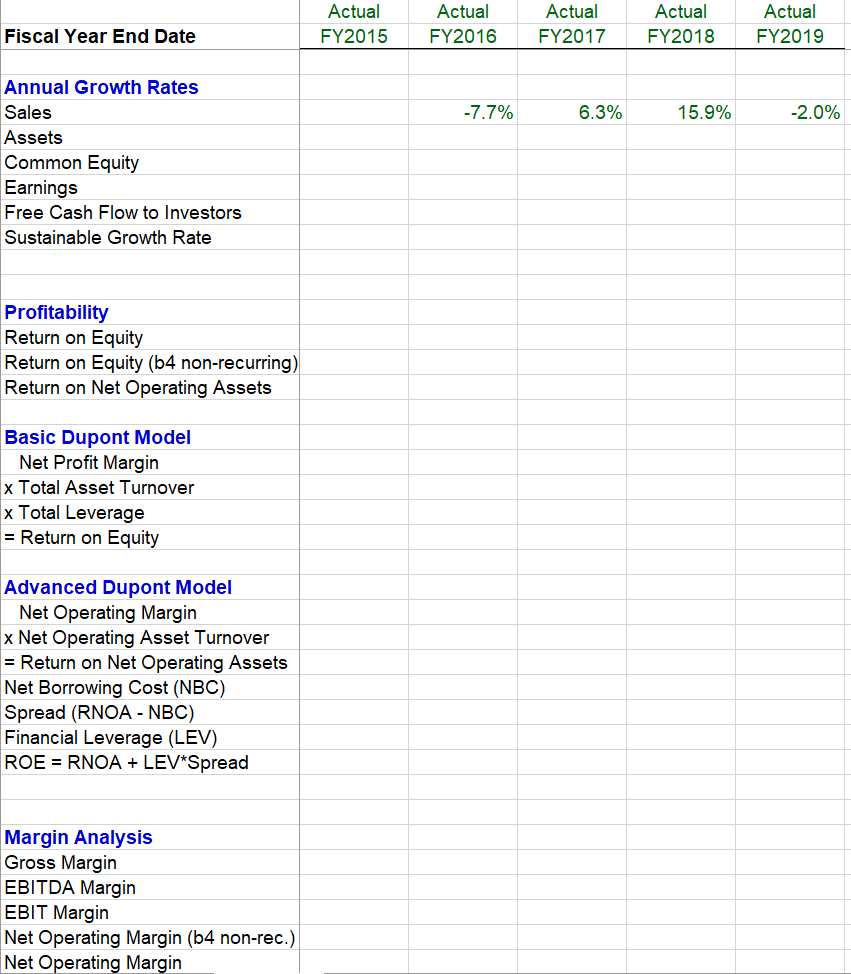
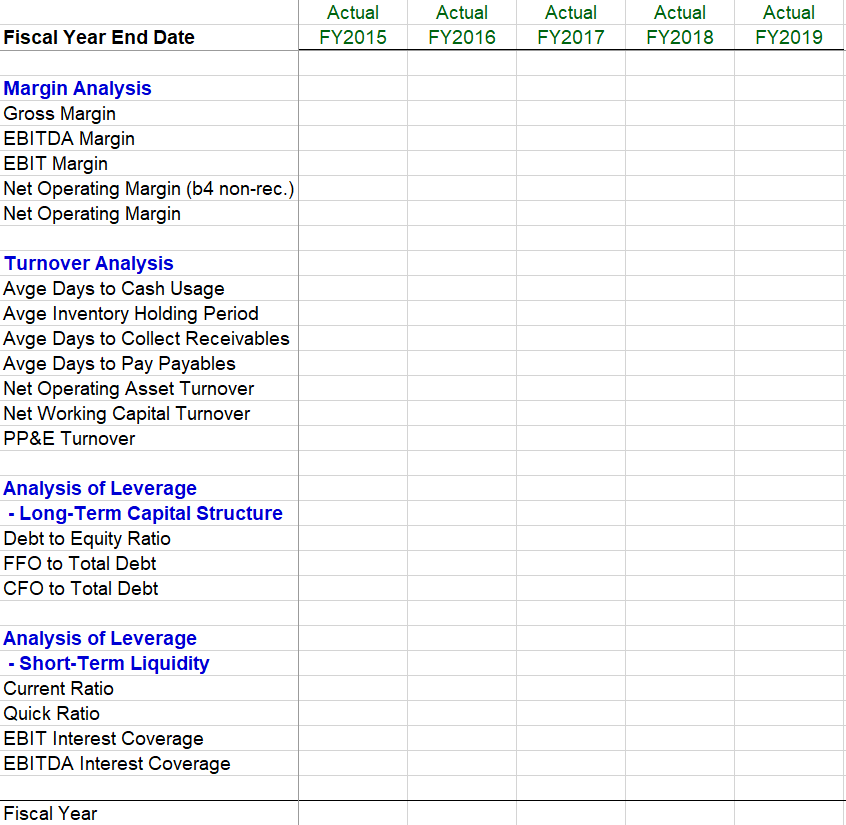
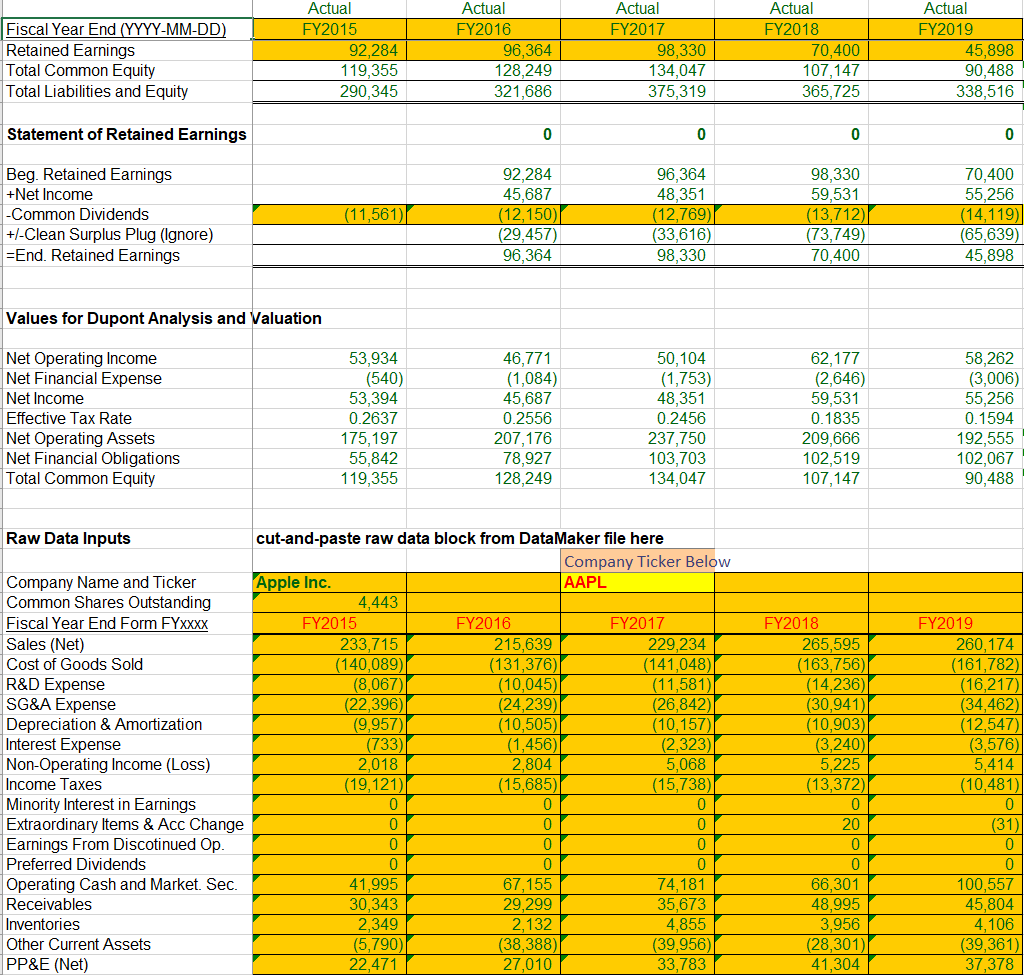
Fiscal Year End (YYYY-MM-DD) Retained Earnings Total Common Equity Total Liabilities and Equity Actual FY2015 92.284 119,355 290,345 Actual FY2016 96,364 128,249 321,686 Actual FY2017 98,330 134,047 375,319 Actual FY2018 70,400 107,147 365,725 Actual FY2019 45,898 90.488 338,516 Statement of Retained Earnings 0 0 0 0 Beg. Retained Earnings +Net Income -Common Dividends +/-Clean Surplus Plug (Ignore) =End. Retained Earnings (11,561) 92,284 45,687 (12,150)| (29,457) 96,364 96,364 48,351 (12,769) (33,616) 98,330 98,330 59,531 (13,712) (73,749) 70,400 70,400 55,256 (14,119) (65,639) 45.898 Values for Dupont Analysis and Valuation Net Operating Income Net Financial Expense Net Income Effective Tax Rate Net Operating Assets Net Financial Obligations Total Common Equity 53,934 (540) 53,394 0.2637 175,197 55,842 119,355 46,771 (1,084) 45,687 0.2556 207,176 78,927 128,249 50,104 (1,753) 48,351 0.2456 237,750 103,703 134,047 62,177 (2,646) 59,531 0.1835 209,666 102,519 107,147 58,262 (3,006) 55,256 0.1594 192,555 102,067 90,488 Raw Data Inputs Company Name and Ticker Common Shares Outstanding Fiscal Year End Form FYxxxx Sales (Net) Cost of Goods Sold R&D Expense SG&A Expense Depreciation & Amortization Interest Expense Non-Operating Income (Loss) Income Taxes Minority Interest in Earnings Extraordinary Items & Acc Change Earnings From Discotinued Op. Preferred Dividends Operating Cash and Market. Sec. Receivables Inventories Other Current Assets PP&E (Net) cut-and-paste raw data block from DataMaker file here Company Ticker Below Apple Inc. AAPL 4,443 FY2015 FY2016 FY2017 233,715 215,639 229,234 (140,089) (131,376) (141,048) (8,067) (10,045 (11,581) (22,396) (24,239) (26,842) (9,957) (10,505) (10,157) (733) (1,456) (2,323) 2,018 2,804 5,068 (19,121) (15,685 (15,738) 0 0 0 0 0 0 0 0 0 0 0 0 41,995 67,155 74,181 30,343 29,299 35,673 2,349 2,132 4,855 (5,790) (38,388) (39,956) 22,471 27,010 33,783 FY2018 265,595 (163,756) (14,236) (30,941) (10,903) (3,240) 5,225 (13,372) 0 20 0 0 66,301 48,995 3,956 (28,301) 41,304 FY2019 260,174 (161,782) (16,217) (34,462) (12,547) (3,576) 5,414 (10,481) 0 (31) 0 0 100,557 45,804 4,106 (39,361) 37,378 Investments Intangibles Other Assets Current Debt Accounts Payable Income Taxes Payable Other Current Liabilities Long-Term Debt Other Liabilities Deferred Taxes Minority Interest Preferred Stock Paid in Common Capital (Net) Retained Earnings Common Dividends 184,546 9,009 5,422 2,513 35,490 0 42,607 53,329 12,989 24,062 0 0 27,071 92,284 11,561 217,101 8,620 8,757 3,500 37,294 0 38,212 75,427 12,985 26,019 0 0 31,885 96,364 12,150 248,606 0 18,177 6,496 44,242 0 50,076 97,207 11,747 31,504 0 0 35,717 98,330 12,769 211,187 0 22,283 8,784 55,888 0 51,257 93,735 48,914 0 0 0 36,747 70,400 13,712 157,054 0 32,978 10,260 46,236 0 49,222 91,807 50,503 0 0 0 44,590 45,898 14,119 Actual FY2015 Actual FY2016 Actual FY2017 Actual FY2018 Actual FY2019 Fiscal Year End Date -7.7% 6.3% 15.9% -2.0% Annual Growth Rates Sales Assets Common Equity Earnings Free Cash Flow to Investors Sustainable Growth Rate Profitability Return on Equity Return on Equity (b4 non-recurring) Return on Net Operating Assets Basic Dupont Model Jet Profit Margin x Total Asset Turnover x Total Leverage = Return on Equity Advanced Dupont Model Net Operating Margin x Net Operating Asset Turnover = Return on Net Operating Assets Net Borrowing Cost (NBC) Spread (RNOA - NBC) Financial Leverage (LEV) ROE = RNOA + LEV*Spread Margin Analysis Gross Margin EBITDA Margin EBIT Margin Net Operating Margin (b4 non-rec.) Net Operating Margin Actual FY2015 Actual FY2016 Actual FY2017 Actual FY2018 Actual FY2019 Fiscal Year End Date Margin Analysis Gross Margin EBITDA Margin EBIT Margin Net Operating Margin (b4 non-rec.) Net Operating Margin Turnover Analysis Avge Days to Cash Usage Avge Inventory Holding Period Avge Days to Collect Receivables Avge Days to Pay Payables Net Operating Asset Turnover Net Working Capital Turnover PP&E Turnover Analysis of Leverage - Long-Term Capital Structure Debt to Equity Ratio FFO to Total Debt CFO to Total Debt Analysis of Leverage - Short-Term Liquidity Current Ratio Quick Ratio EBIT Interest Coverage EBITDA Interest Coverage Fiscal Year


