Answered step by step
Verified Expert Solution
Link Copied!

Question

1 Approved Answer

Applied 8. This question involves the use of simple linear regression on the Auto data set (a) Use the 1m) function to perform a simple
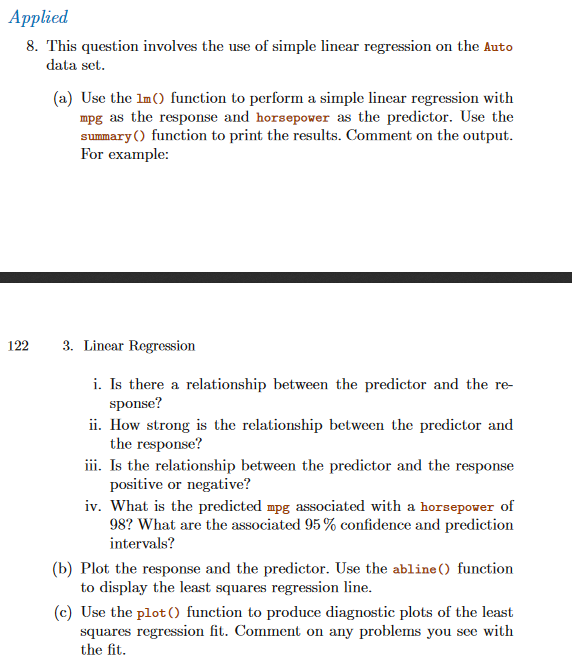
image text in transcribed

Applied 8. This question involves the use of simple linear regression on the Auto data set (a) Use the 1m) function to perform a simple lincar regression with mpg as the response and horsepower as the predictor. Use the summary) function to print the results. Comment on the output For example: 122 3. Linear Regression i. Is there a relationship between the predictor and the re- ii. How strong is the relationship between the predictor and iii. Is the relationship between the predictor and the response sponse? the response? positive or negative!? iv. What is the predicted mpg associated with a horsepower of 98? what are the associated 95% confidence and prediction (b) Plot the response and the predictor. Use the abline) function (c) Use the plot O function to produce diagnostic plots of the least intervals? to display the least squares regression line. squares regression fit. Comment on any problems you see with the fit. Applied 8. This question involves the use of simple linear regression on the Auto data set (a) Use the 1m) function to perform a simple lincar regression with mpg as the response and horsepower as the predictor. Use the summary) function to print the results. Comment on the output For example: 122 3. Linear Regression i. Is there a relationship between the predictor and the re- ii. How strong is the relationship between the predictor and iii. Is the relationship between the predictor and the response sponse? the response? positive or negative!? iv. What is the predicted mpg associated with a horsepower of 98? what are the associated 95% confidence and prediction (b) Plot the response and the predictor. Use the abline) function (c) Use the plot O function to produce diagnostic plots of the least intervals? to display the least squares regression line. squares regression fit. Comment on any problems you see with the fit

Step by Step Solution

There are 3 Steps involved in it

Step: 1

blur-text-image

Get Instant Access to Expert-Tailored Solutions

See step-by-step solutions with expert insights and AI powered tools for academic success

Step: 2

blur-text-image

Step: 3

blur-text-image

Ace Your Homework with AI

Get the answers you need in no time with our AI-driven, step-by-step assistance

Get Started

Students also viewed these Databases questions